Cheyenne vs Scottish Single Mother Households
COMPARE
Cheyenne
Scottish
Single Mother Households
Single Mother Households Comparison
Cheyenne
Scottish
8.1%
SINGLE MOTHER HOUSEHOLDS
0.0/ 100
METRIC RATING
309th/ 347
METRIC RANK
5.8%
SINGLE MOTHER HOUSEHOLDS
96.2/ 100
METRIC RATING
103rd/ 347
METRIC RANK
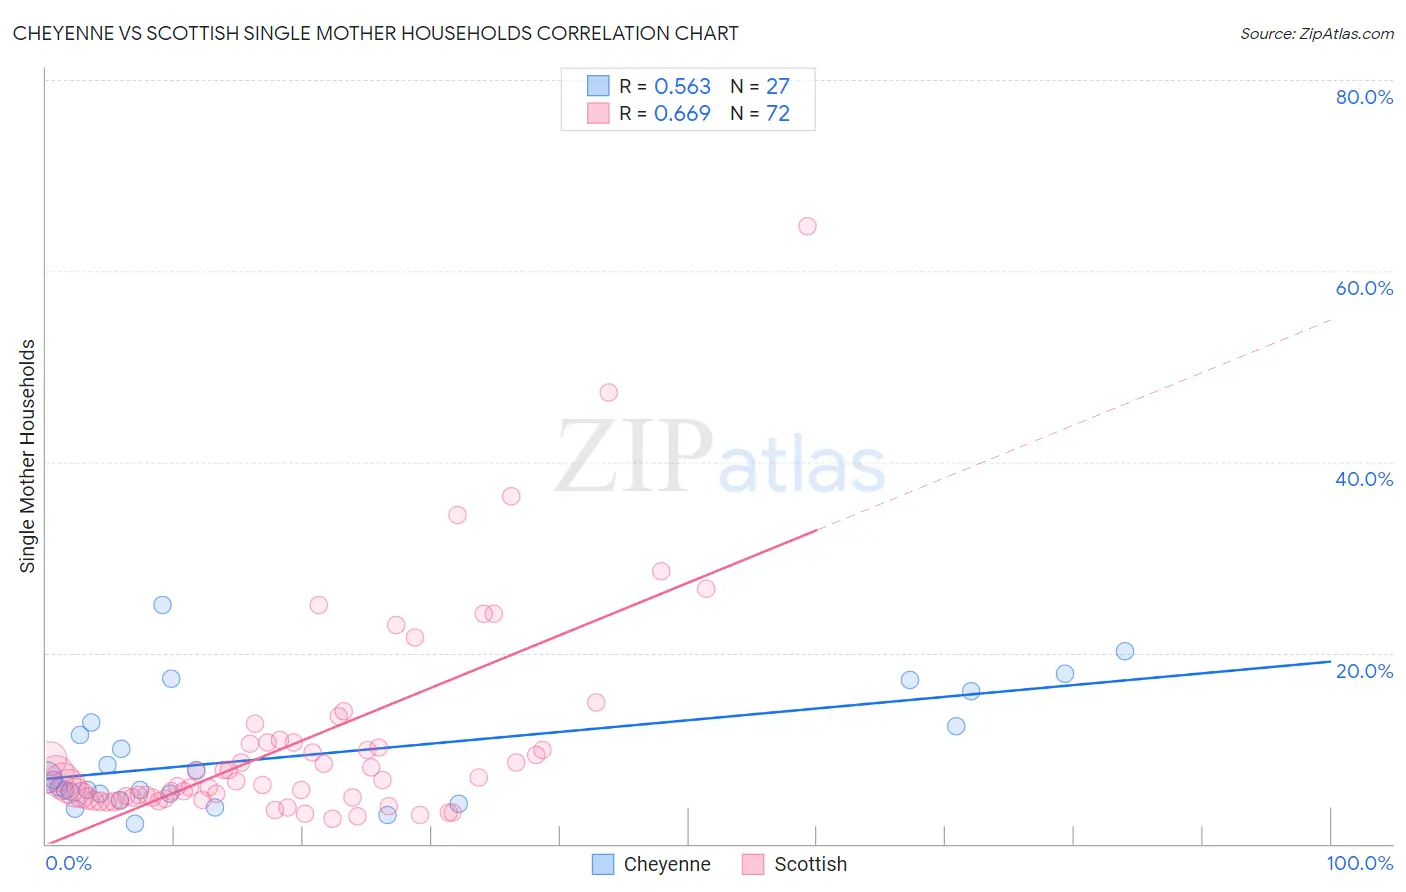
Cheyenne vs Scottish Single Mother Households Correlation Chart
The statistical analysis conducted on geographies consisting of 80,615,278 people shows a substantial positive correlation between the proportion of Cheyenne and percentage of single mother households in the United States with a correlation coefficient (R) of 0.563 and weighted average of 8.1%. Similarly, the statistical analysis conducted on geographies consisting of 561,711,947 people shows a significant positive correlation between the proportion of Scottish and percentage of single mother households in the United States with a correlation coefficient (R) of 0.669 and weighted average of 5.8%, a difference of 40.5%.
Single Mother Households Correlation Summary
| Measurement | Cheyenne | Scottish |
| Minimum | 2.1% | 2.6% |
| Maximum | 25.0% | 64.7% |
| Range | 22.9% | 62.1% |
| Mean | 9.2% | 10.6% |
| Median | 6.7% | 6.6% |
| Interquartile 25% (IQ1) | 5.2% | 4.8% |
| Interquartile 75% (IQ3) | 12.7% | 10.5% |
| Interquartile Range (IQR) | 7.5% | 5.7% |
| Standard Deviation (Sample) | 6.0% | 10.9% |
| Standard Deviation (Population) | 5.9% | 10.8% |
Similar Demographics by Single Mother Households
Demographics Similar to Cheyenne by Single Mother Households
In terms of single mother households, the demographic groups most similar to Cheyenne are Honduran (8.1%, a difference of 0.050%), Immigrants from Congo (8.1%, a difference of 0.35%), Immigrants from Central America (8.1%, a difference of 0.44%), Immigrants from St. Vincent and the Grenadines (8.0%, a difference of 0.46%), and Bangladeshi (8.1%, a difference of 0.64%).
| Demographics | Rating | Rank | Single Mother Households |
| Immigrants | Ghana | 0.0 /100 | #302 | Tragic 8.0% |
| Immigrants | Bahamas | 0.0 /100 | #303 | Tragic 8.0% |
| Natives/Alaskans | 0.0 /100 | #304 | Tragic 8.0% |
| Colville | 0.0 /100 | #305 | Tragic 8.0% |
| Immigrants | Barbados | 0.0 /100 | #306 | Tragic 8.0% |
| Immigrants | St. Vincent and the Grenadines | 0.0 /100 | #307 | Tragic 8.0% |
| Immigrants | Central America | 0.0 /100 | #308 | Tragic 8.1% |
| Cheyenne | 0.0 /100 | #309 | Tragic 8.1% |
| Hondurans | 0.0 /100 | #310 | Tragic 8.1% |
| Immigrants | Congo | 0.0 /100 | #311 | Tragic 8.1% |
| Bangladeshis | 0.0 /100 | #312 | Tragic 8.1% |
| Immigrants | Grenada | 0.0 /100 | #313 | Tragic 8.2% |
| Immigrants | Mexico | 0.0 /100 | #314 | Tragic 8.2% |
| Immigrants | Western Africa | 0.0 /100 | #315 | Tragic 8.2% |
| Africans | 0.0 /100 | #316 | Tragic 8.2% |
Demographics Similar to Scottish by Single Mother Households
In terms of single mother households, the demographic groups most similar to Scottish are Northern European (5.8%, a difference of 0.010%), German (5.8%, a difference of 0.020%), English (5.8%, a difference of 0.020%), Scandinavian (5.8%, a difference of 0.050%), and Immigrants from Poland (5.8%, a difference of 0.070%).
| Demographics | Rating | Rank | Single Mother Households |
| Austrians | 96.4 /100 | #96 | Exceptional 5.7% |
| Tlingit-Haida | 96.4 /100 | #97 | Exceptional 5.7% |
| Immigrants | South Africa | 96.3 /100 | #98 | Exceptional 5.7% |
| Immigrants | Poland | 96.3 /100 | #99 | Exceptional 5.8% |
| Scandinavians | 96.2 /100 | #100 | Exceptional 5.8% |
| Germans | 96.2 /100 | #101 | Exceptional 5.8% |
| English | 96.2 /100 | #102 | Exceptional 5.8% |
| Scottish | 96.2 /100 | #103 | Exceptional 5.8% |
| Northern Europeans | 96.2 /100 | #104 | Exceptional 5.8% |
| Taiwanese | 96.1 /100 | #105 | Exceptional 5.8% |
| Immigrants | Ukraine | 95.9 /100 | #106 | Exceptional 5.8% |
| Paraguayans | 95.8 /100 | #107 | Exceptional 5.8% |
| Immigrants | Italy | 95.8 /100 | #108 | Exceptional 5.8% |
| Immigrants | Western Europe | 95.7 /100 | #109 | Exceptional 5.8% |
| British | 95.5 /100 | #110 | Exceptional 5.8% |