Cheyenne vs Immigrants from Caribbean Single Mother Households
COMPARE
Cheyenne
Immigrants from Caribbean
Single Mother Households
Single Mother Households Comparison
Cheyenne
Immigrants from Caribbean
8.1%
SINGLE MOTHER HOUSEHOLDS
0.0/ 100
METRIC RATING
309th/ 347
METRIC RANK
8.4%
SINGLE MOTHER HOUSEHOLDS
0.0/ 100
METRIC RATING
325th/ 347
METRIC RANK
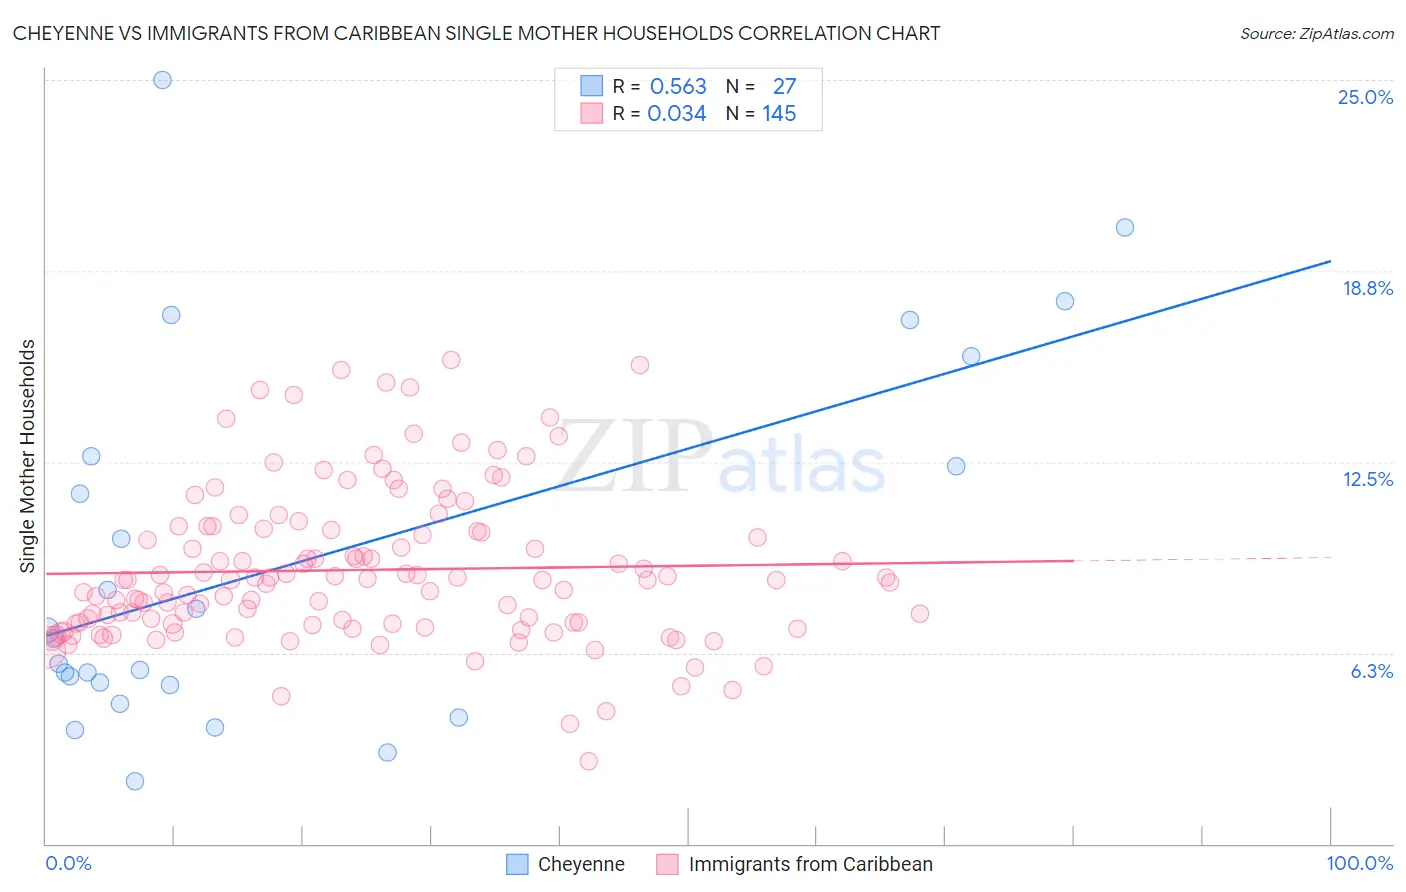
Cheyenne vs Immigrants from Caribbean Single Mother Households Correlation Chart
The statistical analysis conducted on geographies consisting of 80,615,278 people shows a substantial positive correlation between the proportion of Cheyenne and percentage of single mother households in the United States with a correlation coefficient (R) of 0.563 and weighted average of 8.1%. Similarly, the statistical analysis conducted on geographies consisting of 448,351,427 people shows no correlation between the proportion of Immigrants from Caribbean and percentage of single mother households in the United States with a correlation coefficient (R) of 0.034 and weighted average of 8.4%, a difference of 3.5%.
Single Mother Households Correlation Summary
| Measurement | Cheyenne | Immigrants from Caribbean |
| Minimum | 2.1% | 2.7% |
| Maximum | 25.0% | 15.8% |
| Range | 22.9% | 13.1% |
| Mean | 9.2% | 9.0% |
| Median | 6.7% | 8.6% |
| Interquartile 25% (IQ1) | 5.2% | 7.2% |
| Interquartile 75% (IQ3) | 12.7% | 10.3% |
| Interquartile Range (IQR) | 7.5% | 3.1% |
| Standard Deviation (Sample) | 6.0% | 2.5% |
| Standard Deviation (Population) | 5.9% | 2.5% |
Demographics Similar to Cheyenne and Immigrants from Caribbean by Single Mother Households
In terms of single mother households, the demographic groups most similar to Cheyenne are Honduran (8.1%, a difference of 0.050%), Immigrants from Congo (8.1%, a difference of 0.35%), Immigrants from Central America (8.1%, a difference of 0.44%), Immigrants from St. Vincent and the Grenadines (8.0%, a difference of 0.46%), and Bangladeshi (8.1%, a difference of 0.64%). Similarly, the demographic groups most similar to Immigrants from Caribbean are British West Indian (8.4%, a difference of 0.12%), Immigrants from Jamaica (8.4%, a difference of 0.18%), Immigrants from Haiti (8.4%, a difference of 0.27%), Haitian (8.3%, a difference of 0.61%), and Pima (8.3%, a difference of 1.1%).
| Demographics | Rating | Rank | Single Mother Households |
| Immigrants | St. Vincent and the Grenadines | 0.0 /100 | #307 | Tragic 8.0% |
| Immigrants | Central America | 0.0 /100 | #308 | Tragic 8.1% |
| Cheyenne | 0.0 /100 | #309 | Tragic 8.1% |
| Hondurans | 0.0 /100 | #310 | Tragic 8.1% |
| Immigrants | Congo | 0.0 /100 | #311 | Tragic 8.1% |
| Bangladeshis | 0.0 /100 | #312 | Tragic 8.1% |
| Immigrants | Grenada | 0.0 /100 | #313 | Tragic 8.2% |
| Immigrants | Mexico | 0.0 /100 | #314 | Tragic 8.2% |
| Immigrants | Western Africa | 0.0 /100 | #315 | Tragic 8.2% |
| Africans | 0.0 /100 | #316 | Tragic 8.2% |
| Immigrants | Honduras | 0.0 /100 | #317 | Tragic 8.2% |
| Senegalese | 0.0 /100 | #318 | Tragic 8.2% |
| Jamaicans | 0.0 /100 | #319 | Tragic 8.2% |
| Bahamians | 0.0 /100 | #320 | Tragic 8.3% |
| Immigrants | Senegal | 0.0 /100 | #321 | Tragic 8.3% |
| Pima | 0.0 /100 | #322 | Tragic 8.3% |
| Haitians | 0.0 /100 | #323 | Tragic 8.3% |
| Immigrants | Jamaica | 0.0 /100 | #324 | Tragic 8.4% |
| Immigrants | Caribbean | 0.0 /100 | #325 | Tragic 8.4% |
| British West Indians | 0.0 /100 | #326 | Tragic 8.4% |
| Immigrants | Haiti | 0.0 /100 | #327 | Tragic 8.4% |