Cheyenne vs Immigrants from Africa Single Mother Households
COMPARE
Cheyenne
Immigrants from Africa
Single Mother Households
Single Mother Households Comparison
Cheyenne
Immigrants from Africa
8.1%
SINGLE MOTHER HOUSEHOLDS
0.0/ 100
METRIC RATING
309th/ 347
METRIC RANK
7.3%
SINGLE MOTHER HOUSEHOLDS
0.4/ 100
METRIC RATING
250th/ 347
METRIC RANK
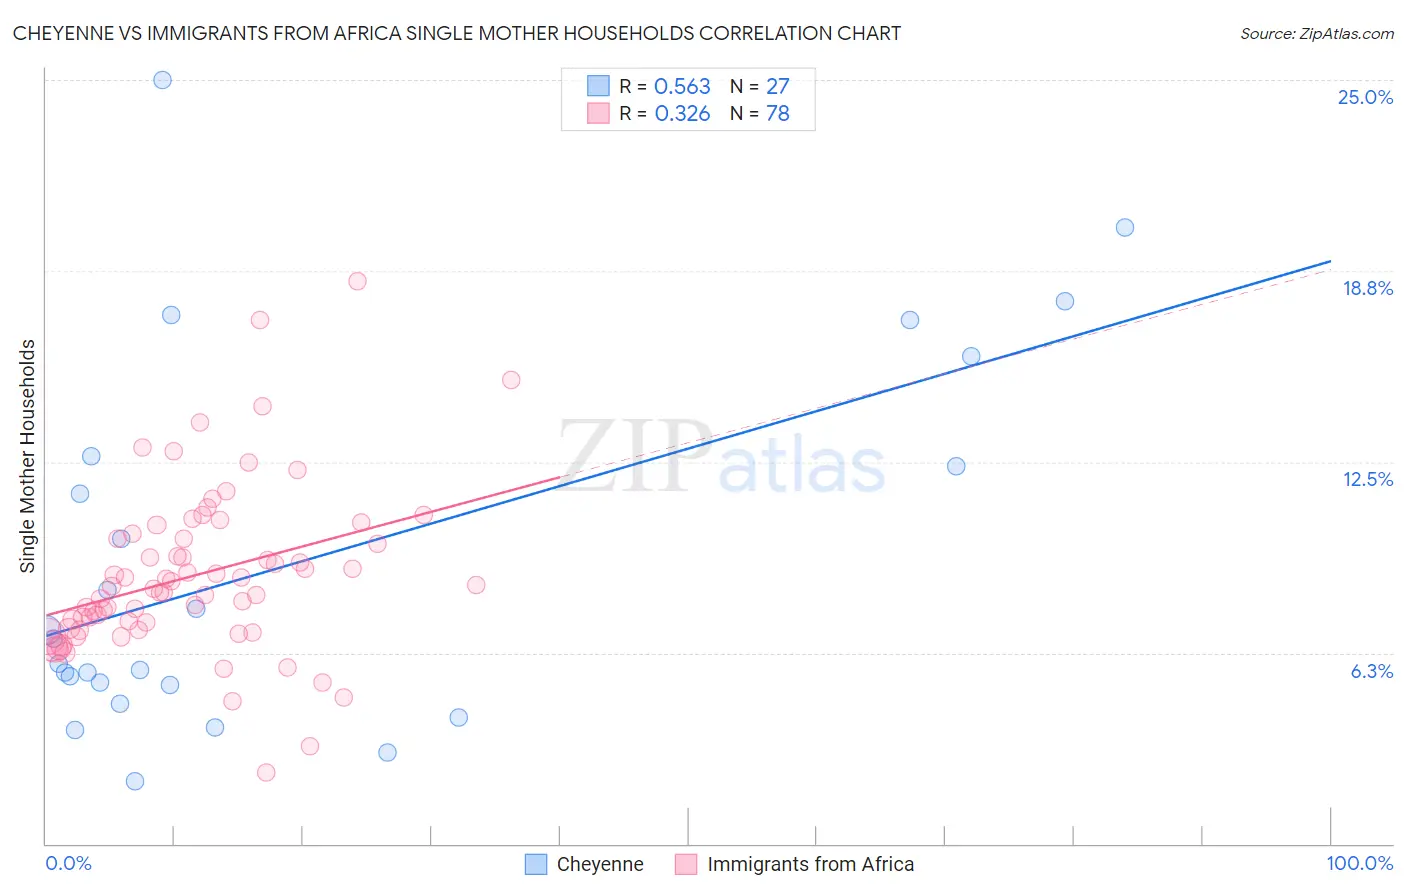
Cheyenne vs Immigrants from Africa Single Mother Households Correlation Chart
The statistical analysis conducted on geographies consisting of 80,615,278 people shows a substantial positive correlation between the proportion of Cheyenne and percentage of single mother households in the United States with a correlation coefficient (R) of 0.563 and weighted average of 8.1%. Similarly, the statistical analysis conducted on geographies consisting of 467,655,792 people shows a mild positive correlation between the proportion of Immigrants from Africa and percentage of single mother households in the United States with a correlation coefficient (R) of 0.326 and weighted average of 7.3%, a difference of 11.1%.
Single Mother Households Correlation Summary
| Measurement | Cheyenne | Immigrants from Africa |
| Minimum | 2.1% | 2.3% |
| Maximum | 25.0% | 18.4% |
| Range | 22.9% | 16.1% |
| Mean | 9.2% | 8.8% |
| Median | 6.7% | 8.4% |
| Interquartile 25% (IQ1) | 5.2% | 7.0% |
| Interquartile 75% (IQ3) | 12.7% | 10.0% |
| Interquartile Range (IQR) | 7.5% | 3.0% |
| Standard Deviation (Sample) | 6.0% | 2.7% |
| Standard Deviation (Population) | 5.9% | 2.7% |
Similar Demographics by Single Mother Households
Demographics Similar to Cheyenne by Single Mother Households
In terms of single mother households, the demographic groups most similar to Cheyenne are Honduran (8.1%, a difference of 0.050%), Immigrants from Congo (8.1%, a difference of 0.35%), Immigrants from Central America (8.1%, a difference of 0.44%), Immigrants from St. Vincent and the Grenadines (8.0%, a difference of 0.46%), and Bangladeshi (8.1%, a difference of 0.64%).
| Demographics | Rating | Rank | Single Mother Households |
| Immigrants | Ghana | 0.0 /100 | #302 | Tragic 8.0% |
| Immigrants | Bahamas | 0.0 /100 | #303 | Tragic 8.0% |
| Natives/Alaskans | 0.0 /100 | #304 | Tragic 8.0% |
| Colville | 0.0 /100 | #305 | Tragic 8.0% |
| Immigrants | Barbados | 0.0 /100 | #306 | Tragic 8.0% |
| Immigrants | St. Vincent and the Grenadines | 0.0 /100 | #307 | Tragic 8.0% |
| Immigrants | Central America | 0.0 /100 | #308 | Tragic 8.1% |
| Cheyenne | 0.0 /100 | #309 | Tragic 8.1% |
| Hondurans | 0.0 /100 | #310 | Tragic 8.1% |
| Immigrants | Congo | 0.0 /100 | #311 | Tragic 8.1% |
| Bangladeshis | 0.0 /100 | #312 | Tragic 8.1% |
| Immigrants | Grenada | 0.0 /100 | #313 | Tragic 8.2% |
| Immigrants | Mexico | 0.0 /100 | #314 | Tragic 8.2% |
| Immigrants | Western Africa | 0.0 /100 | #315 | Tragic 8.2% |
| Africans | 0.0 /100 | #316 | Tragic 8.2% |
Demographics Similar to Immigrants from Africa by Single Mother Households
In terms of single mother households, the demographic groups most similar to Immigrants from Africa are Bermudan (7.3%, a difference of 0.010%), Spanish American Indian (7.3%, a difference of 0.30%), Dutch West Indian (7.3%, a difference of 0.33%), Malaysian (7.3%, a difference of 0.34%), and Alaskan Athabascan (7.3%, a difference of 0.37%).
| Demographics | Rating | Rank | Single Mother Households |
| Ecuadorians | 0.6 /100 | #243 | Tragic 7.2% |
| Cubans | 0.6 /100 | #244 | Tragic 7.2% |
| Immigrants | Cambodia | 0.5 /100 | #245 | Tragic 7.2% |
| Nicaraguans | 0.5 /100 | #246 | Tragic 7.2% |
| Dutch West Indians | 0.4 /100 | #247 | Tragic 7.3% |
| Spanish American Indians | 0.4 /100 | #248 | Tragic 7.3% |
| Bermudans | 0.4 /100 | #249 | Tragic 7.3% |
| Immigrants | Africa | 0.4 /100 | #250 | Tragic 7.3% |
| Malaysians | 0.3 /100 | #251 | Tragic 7.3% |
| Alaskan Athabascans | 0.3 /100 | #252 | Tragic 7.3% |
| Cajuns | 0.3 /100 | #253 | Tragic 7.3% |
| Immigrants | Ecuador | 0.3 /100 | #254 | Tragic 7.3% |
| Mexican American Indians | 0.2 /100 | #255 | Tragic 7.4% |
| Seminole | 0.2 /100 | #256 | Tragic 7.4% |
| Alaska Natives | 0.2 /100 | #257 | Tragic 7.4% |