Cheyenne vs Immigrants Single Mother Households
COMPARE
Cheyenne
Immigrants
Single Mother Households
Single Mother Households Comparison
Cheyenne
Immigrants
8.1%
SINGLE MOTHER HOUSEHOLDS
0.0/ 100
METRIC RATING
309th/ 347
METRIC RANK
6.8%
SINGLE MOTHER HOUSEHOLDS
4.3/ 100
METRIC RATING
219th/ 347
METRIC RANK
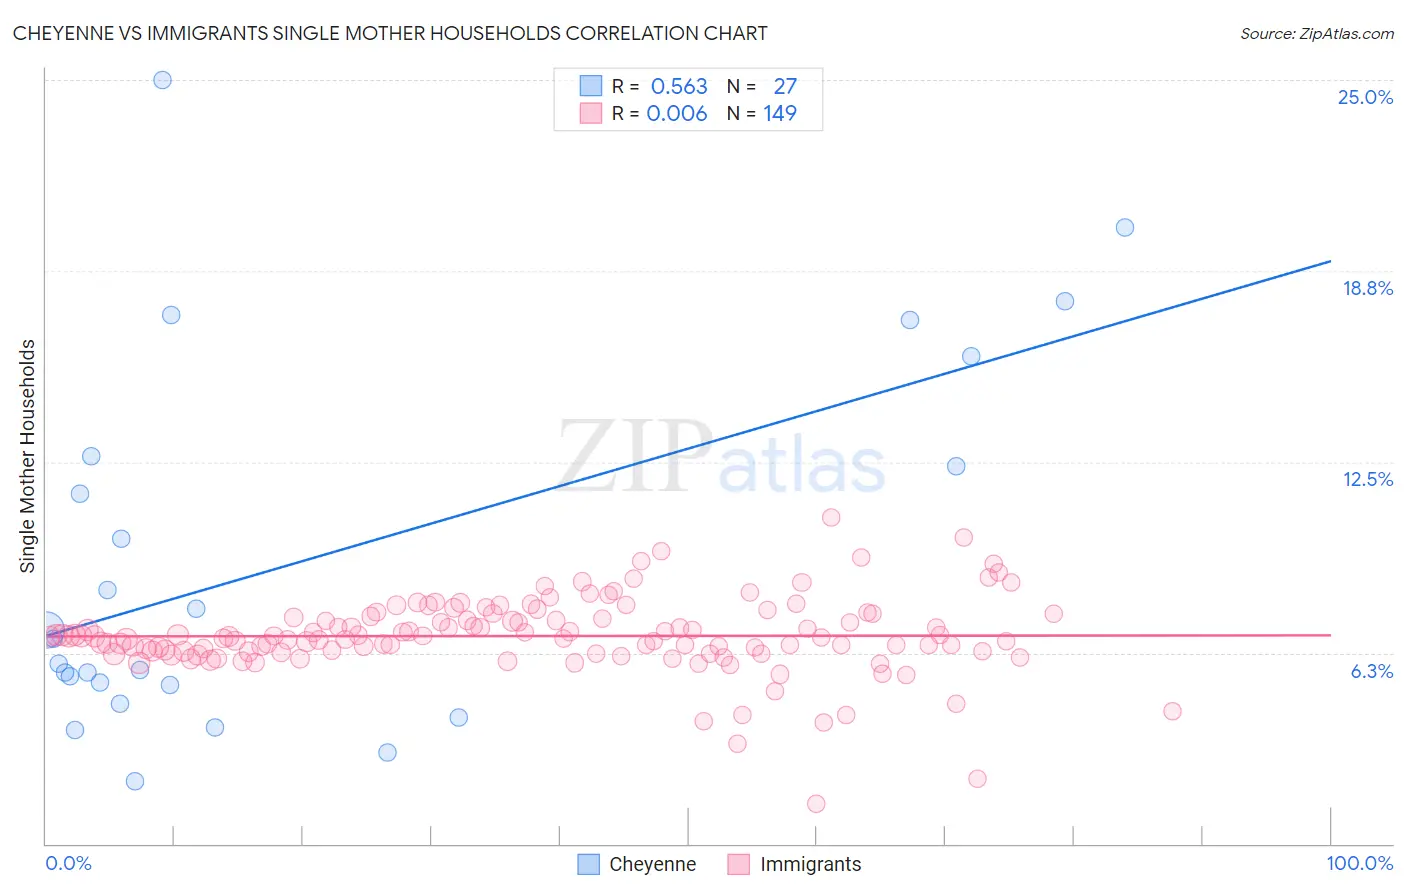
Cheyenne vs Immigrants Single Mother Households Correlation Chart
The statistical analysis conducted on geographies consisting of 80,615,278 people shows a substantial positive correlation between the proportion of Cheyenne and percentage of single mother households in the United States with a correlation coefficient (R) of 0.563 and weighted average of 8.1%. Similarly, the statistical analysis conducted on geographies consisting of 572,041,298 people shows no correlation between the proportion of Immigrants and percentage of single mother households in the United States with a correlation coefficient (R) of 0.006 and weighted average of 6.8%, a difference of 18.1%.
Single Mother Households Correlation Summary
| Measurement | Cheyenne | Immigrants |
| Minimum | 2.1% | 1.3% |
| Maximum | 25.0% | 10.7% |
| Range | 22.9% | 9.4% |
| Mean | 9.2% | 6.8% |
| Median | 6.7% | 6.8% |
| Interquartile 25% (IQ1) | 5.2% | 6.3% |
| Interquartile 75% (IQ3) | 12.7% | 7.4% |
| Interquartile Range (IQR) | 7.5% | 1.1% |
| Standard Deviation (Sample) | 6.0% | 1.3% |
| Standard Deviation (Population) | 5.9% | 1.3% |
Similar Demographics by Single Mother Households
Demographics Similar to Cheyenne by Single Mother Households
In terms of single mother households, the demographic groups most similar to Cheyenne are Honduran (8.1%, a difference of 0.050%), Immigrants from Congo (8.1%, a difference of 0.35%), Immigrants from Central America (8.1%, a difference of 0.44%), Immigrants from St. Vincent and the Grenadines (8.0%, a difference of 0.46%), and Bangladeshi (8.1%, a difference of 0.64%).
| Demographics | Rating | Rank | Single Mother Households |
| Immigrants | Ghana | 0.0 /100 | #302 | Tragic 8.0% |
| Immigrants | Bahamas | 0.0 /100 | #303 | Tragic 8.0% |
| Natives/Alaskans | 0.0 /100 | #304 | Tragic 8.0% |
| Colville | 0.0 /100 | #305 | Tragic 8.0% |
| Immigrants | Barbados | 0.0 /100 | #306 | Tragic 8.0% |
| Immigrants | St. Vincent and the Grenadines | 0.0 /100 | #307 | Tragic 8.0% |
| Immigrants | Central America | 0.0 /100 | #308 | Tragic 8.1% |
| Cheyenne | 0.0 /100 | #309 | Tragic 8.1% |
| Hondurans | 0.0 /100 | #310 | Tragic 8.1% |
| Immigrants | Congo | 0.0 /100 | #311 | Tragic 8.1% |
| Bangladeshis | 0.0 /100 | #312 | Tragic 8.1% |
| Immigrants | Grenada | 0.0 /100 | #313 | Tragic 8.2% |
| Immigrants | Mexico | 0.0 /100 | #314 | Tragic 8.2% |
| Immigrants | Western Africa | 0.0 /100 | #315 | Tragic 8.2% |
| Africans | 0.0 /100 | #316 | Tragic 8.2% |
Demographics Similar to Immigrants by Single Mother Households
In terms of single mother households, the demographic groups most similar to Immigrants are Immigrants from Eastern Africa (6.8%, a difference of 0.090%), Immigrants from Thailand (6.9%, a difference of 0.18%), Aleut (6.8%, a difference of 0.30%), French American Indian (6.9%, a difference of 0.38%), and Immigrants from Bangladesh (6.9%, a difference of 0.40%).
| Demographics | Rating | Rank | Single Mother Households |
| Immigrants | Eritrea | 8.4 /100 | #212 | Tragic 6.7% |
| Immigrants | Costa Rica | 8.2 /100 | #213 | Tragic 6.7% |
| Immigrants | Uruguay | 7.9 /100 | #214 | Tragic 6.7% |
| Shoshone | 5.7 /100 | #215 | Tragic 6.8% |
| Cherokee | 5.1 /100 | #216 | Tragic 6.8% |
| Aleuts | 4.8 /100 | #217 | Tragic 6.8% |
| Immigrants | Eastern Africa | 4.4 /100 | #218 | Tragic 6.8% |
| Immigrants | Immigrants | 4.3 /100 | #219 | Tragic 6.8% |
| Immigrants | Thailand | 4.0 /100 | #220 | Tragic 6.9% |
| French American Indians | 3.7 /100 | #221 | Tragic 6.9% |
| Immigrants | Bangladesh | 3.7 /100 | #222 | Tragic 6.9% |
| Immigrants | Micronesia | 3.6 /100 | #223 | Tragic 6.9% |
| Immigrants | Sudan | 3.5 /100 | #224 | Tragic 6.9% |
| Sudanese | 3.1 /100 | #225 | Tragic 6.9% |
| Paiute | 2.4 /100 | #226 | Tragic 7.0% |