Hopi vs Panamanian Single Father Households
COMPARE
Hopi
Panamanian
Single Father Households
Single Father Households Comparison
Hopi
Panamanians
2.8%
SINGLE FATHER HOUSEHOLDS
0.0/ 100
METRIC RATING
307th/ 347
METRIC RANK
2.4%
SINGLE FATHER HOUSEHOLDS
29.6/ 100
METRIC RATING
194th/ 347
METRIC RANK
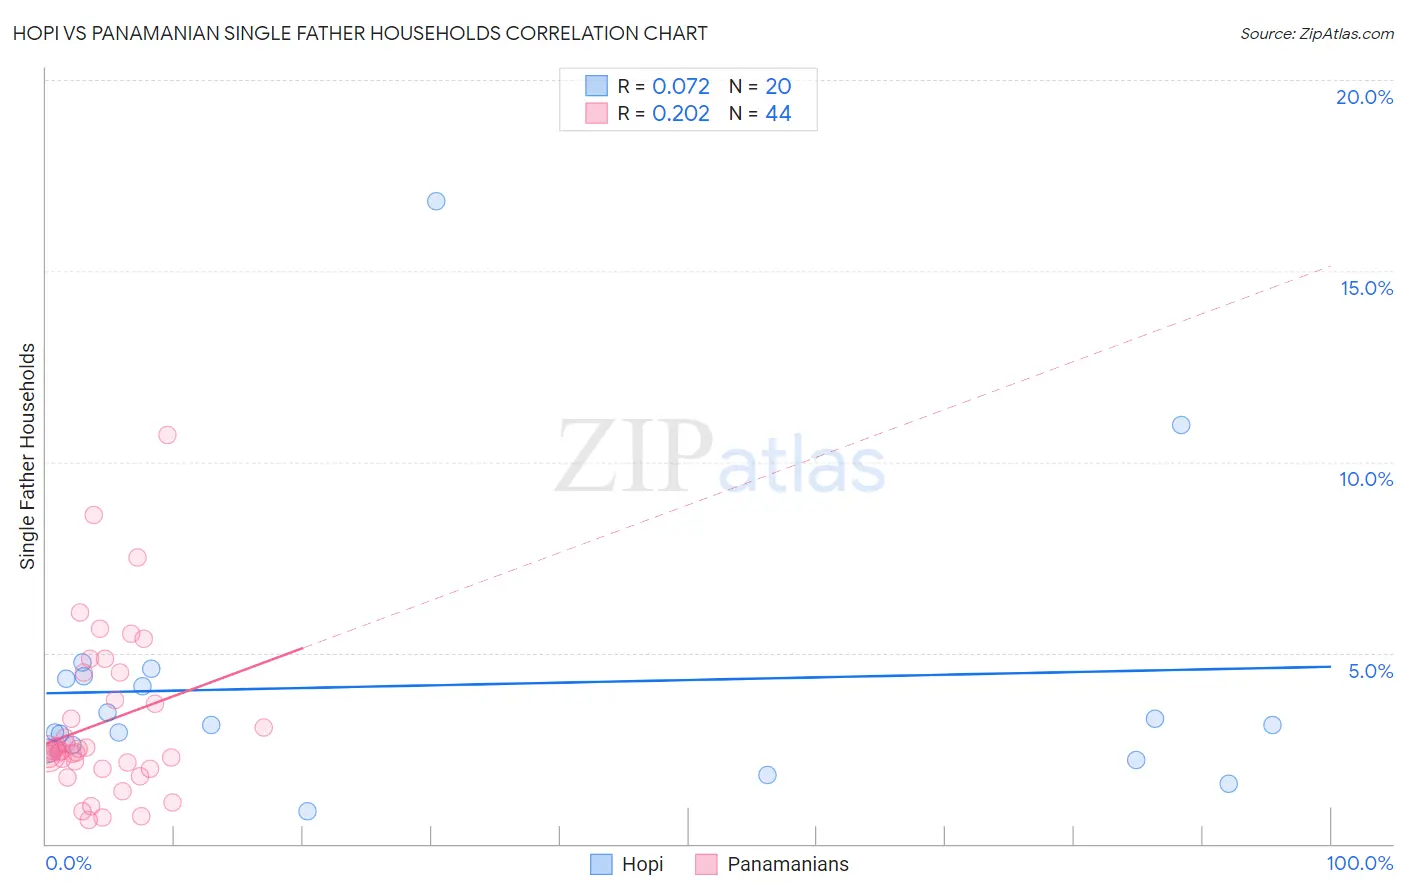
Hopi vs Panamanian Single Father Households Correlation Chart
The statistical analysis conducted on geographies consisting of 74,602,618 people shows a slight positive correlation between the proportion of Hopi and percentage of single father households in the United States with a correlation coefficient (R) of 0.072 and weighted average of 2.8%. Similarly, the statistical analysis conducted on geographies consisting of 279,967,091 people shows a weak positive correlation between the proportion of Panamanians and percentage of single father households in the United States with a correlation coefficient (R) of 0.202 and weighted average of 2.4%, a difference of 19.1%.
Single Father Households Correlation Summary
| Measurement | Hopi | Panamanian |
| Minimum | 0.84% | 0.62% |
| Maximum | 16.8% | 10.7% |
| Range | 16.0% | 10.1% |
| Mean | 4.2% | 3.2% |
| Median | 3.1% | 2.4% |
| Interquartile 25% (IQ1) | 2.5% | 2.1% |
| Interquartile 75% (IQ3) | 4.4% | 4.1% |
| Interquartile Range (IQR) | 1.9% | 2.1% |
| Standard Deviation (Sample) | 3.6% | 2.1% |
| Standard Deviation (Population) | 3.5% | 2.1% |
Similar Demographics by Single Father Households
Demographics Similar to Hopi by Single Father Households
In terms of single father households, the demographic groups most similar to Hopi are Immigrants from the Azores (2.8%, a difference of 0.17%), Apache (2.8%, a difference of 0.18%), Hispanic or Latino (2.8%, a difference of 0.32%), Mexican American Indian (2.8%, a difference of 0.48%), and Immigrants from Honduras (2.8%, a difference of 0.79%).
| Demographics | Rating | Rank | Single Father Households |
| Kiowa | 0.0 /100 | #300 | Tragic 2.8% |
| Immigrants | Latin America | 0.0 /100 | #301 | Tragic 2.8% |
| Spanish Americans | 0.0 /100 | #302 | Tragic 2.8% |
| Immigrants | Honduras | 0.0 /100 | #303 | Tragic 2.8% |
| Mexican American Indians | 0.0 /100 | #304 | Tragic 2.8% |
| Hispanics or Latinos | 0.0 /100 | #305 | Tragic 2.8% |
| Immigrants | Azores | 0.0 /100 | #306 | Tragic 2.8% |
| Hopi | 0.0 /100 | #307 | Tragic 2.8% |
| Apache | 0.0 /100 | #308 | Tragic 2.8% |
| Central Americans | 0.0 /100 | #309 | Tragic 2.9% |
| Immigrants | Laos | 0.0 /100 | #310 | Tragic 2.9% |
| Spanish American Indians | 0.0 /100 | #311 | Tragic 2.9% |
| Tsimshian | 0.0 /100 | #312 | Tragic 2.9% |
| Arapaho | 0.0 /100 | #313 | Tragic 2.9% |
| Salvadorans | 0.0 /100 | #314 | Tragic 2.9% |
Demographics Similar to Panamanians by Single Father Households
In terms of single father households, the demographic groups most similar to Panamanians are Uruguayan (2.4%, a difference of 0.010%), Immigrants from Sudan (2.4%, a difference of 0.020%), Immigrants from Africa (2.4%, a difference of 0.030%), Immigrants from Philippines (2.4%, a difference of 0.080%), and Kenyan (2.4%, a difference of 0.14%).
| Demographics | Rating | Rank | Single Father Households |
| Immigrants | Colombia | 34.0 /100 | #187 | Fair 2.4% |
| Hmong | 33.0 /100 | #188 | Fair 2.4% |
| U.S. Virgin Islanders | 31.8 /100 | #189 | Fair 2.4% |
| French | 31.7 /100 | #190 | Fair 2.4% |
| Immigrants | Africa | 30.0 /100 | #191 | Fair 2.4% |
| Immigrants | Sudan | 29.8 /100 | #192 | Fair 2.4% |
| Uruguayans | 29.7 /100 | #193 | Fair 2.4% |
| Panamanians | 29.6 /100 | #194 | Fair 2.4% |
| Immigrants | Philippines | 28.7 /100 | #195 | Fair 2.4% |
| Kenyans | 28.0 /100 | #196 | Fair 2.4% |
| Germans | 28.0 /100 | #197 | Fair 2.4% |
| Scandinavians | 27.4 /100 | #198 | Fair 2.4% |
| Immigrants | Vietnam | 27.1 /100 | #199 | Fair 2.4% |
| Peruvians | 27.1 /100 | #200 | Fair 2.4% |
| Immigrants | Uganda | 26.0 /100 | #201 | Fair 2.4% |