Immigrants from Colombia vs Immigrants from Kuwait Single Father Households
COMPARE
Immigrants from Colombia
Immigrants from Kuwait
Single Father Households
Single Father Households Comparison
Immigrants from Colombia
Immigrants from Kuwait
2.4%
SINGLE FATHER HOUSEHOLDS
34.0/ 100
METRIC RATING
187th/ 347
METRIC RANK
2.1%
SINGLE FATHER HOUSEHOLDS
99.8/ 100
METRIC RATING
71st/ 347
METRIC RANK
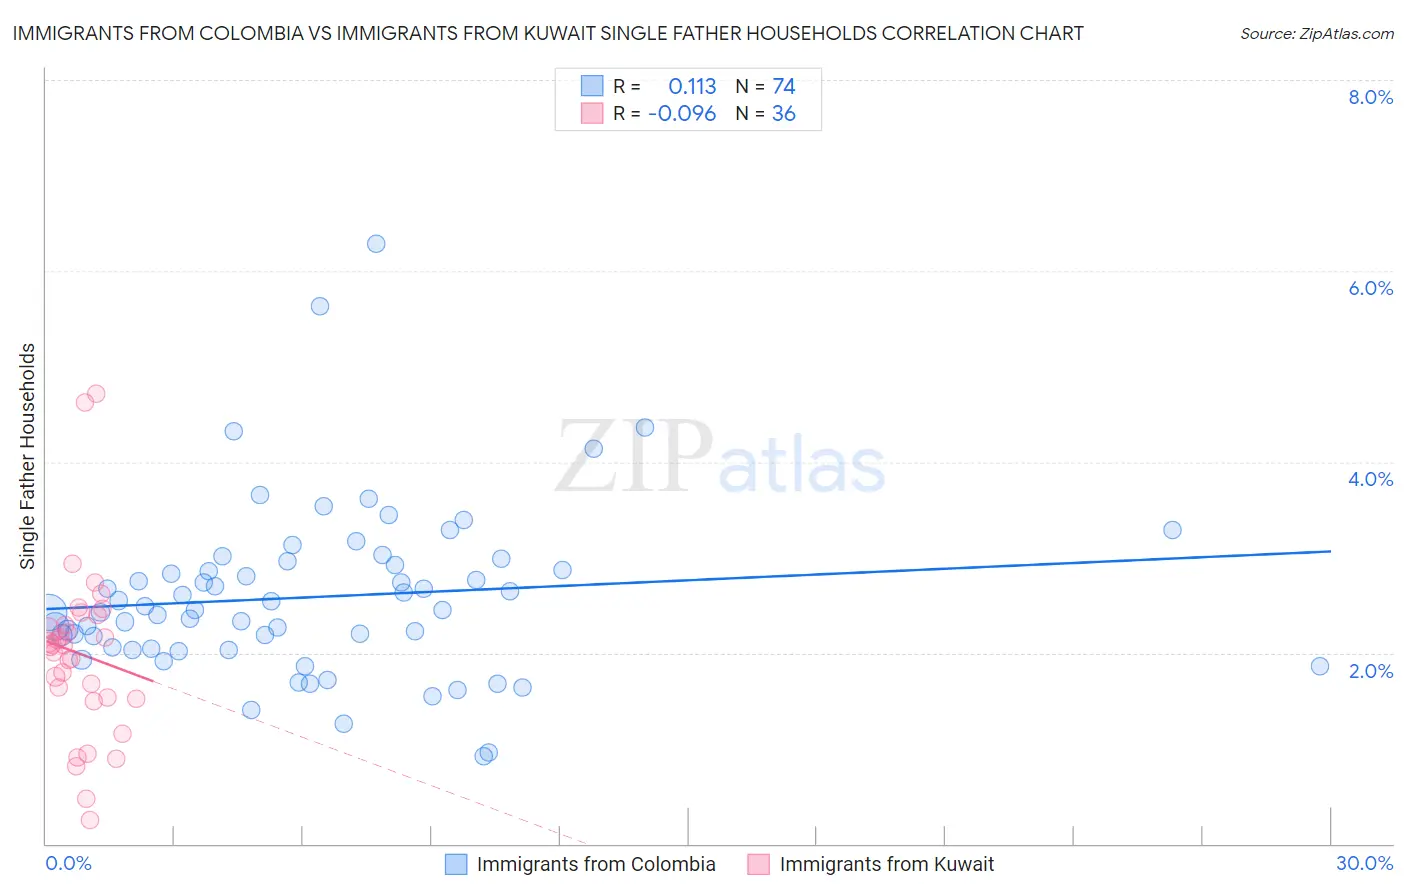
Immigrants from Colombia vs Immigrants from Kuwait Single Father Households Correlation Chart
The statistical analysis conducted on geographies consisting of 375,877,242 people shows a poor positive correlation between the proportion of Immigrants from Colombia and percentage of single father households in the United States with a correlation coefficient (R) of 0.113 and weighted average of 2.4%. Similarly, the statistical analysis conducted on geographies consisting of 136,715,758 people shows a slight negative correlation between the proportion of Immigrants from Kuwait and percentage of single father households in the United States with a correlation coefficient (R) of -0.096 and weighted average of 2.1%, a difference of 14.4%.
Single Father Households Correlation Summary
| Measurement | Immigrants from Colombia | Immigrants from Kuwait |
| Minimum | 0.91% | 0.25% |
| Maximum | 6.3% | 4.7% |
| Range | 5.4% | 4.5% |
| Mean | 2.6% | 2.0% |
| Median | 2.4% | 2.1% |
| Interquartile 25% (IQ1) | 2.0% | 1.5% |
| Interquartile 75% (IQ3) | 2.9% | 2.3% |
| Interquartile Range (IQR) | 0.88% | 0.82% |
| Standard Deviation (Sample) | 0.90% | 0.91% |
| Standard Deviation (Population) | 0.89% | 0.90% |
Similar Demographics by Single Father Households
Demographics Similar to Immigrants from Colombia by Single Father Households
In terms of single father households, the demographic groups most similar to Immigrants from Colombia are Hmong (2.4%, a difference of 0.080%), U.S. Virgin Islander (2.4%, a difference of 0.18%), French (2.4%, a difference of 0.19%), Immigrants from Africa (2.4%, a difference of 0.33%), and Immigrants from Sudan (2.4%, a difference of 0.35%).
| Demographics | Rating | Rank | Single Father Households |
| Yugoslavians | 43.9 /100 | #180 | Average 2.3% |
| Jamaicans | 43.5 /100 | #181 | Average 2.3% |
| Belgians | 43.3 /100 | #182 | Average 2.3% |
| Immigrants | Panama | 41.8 /100 | #183 | Average 2.4% |
| Sri Lankans | 41.8 /100 | #184 | Average 2.4% |
| Nigerians | 41.0 /100 | #185 | Average 2.4% |
| Immigrants | Bosnia and Herzegovina | 40.4 /100 | #186 | Average 2.4% |
| Immigrants | Colombia | 34.0 /100 | #187 | Fair 2.4% |
| Hmong | 33.0 /100 | #188 | Fair 2.4% |
| U.S. Virgin Islanders | 31.8 /100 | #189 | Fair 2.4% |
| French | 31.7 /100 | #190 | Fair 2.4% |
| Immigrants | Africa | 30.0 /100 | #191 | Fair 2.4% |
| Immigrants | Sudan | 29.8 /100 | #192 | Fair 2.4% |
| Uruguayans | 29.7 /100 | #193 | Fair 2.4% |
| Panamanians | 29.6 /100 | #194 | Fair 2.4% |
Demographics Similar to Immigrants from Kuwait by Single Father Households
In terms of single father households, the demographic groups most similar to Immigrants from Kuwait are Immigrants from Spain (2.1%, a difference of 0.0%), Egyptian (2.1%, a difference of 0.010%), Immigrants from Bangladesh (2.1%, a difference of 0.15%), Immigrants from Egypt (2.1%, a difference of 0.15%), and Immigrants from Romania (2.1%, a difference of 0.22%).
| Demographics | Rating | Rank | Single Father Households |
| Mongolians | 99.9 /100 | #64 | Exceptional 2.1% |
| Paraguayans | 99.9 /100 | #65 | Exceptional 2.1% |
| Immigrants | Western Asia | 99.8 /100 | #66 | Exceptional 2.1% |
| Immigrants | Italy | 99.8 /100 | #67 | Exceptional 2.1% |
| Immigrants | Denmark | 99.8 /100 | #68 | Exceptional 2.1% |
| Immigrants | Romania | 99.8 /100 | #69 | Exceptional 2.1% |
| Egyptians | 99.8 /100 | #70 | Exceptional 2.1% |
| Immigrants | Kuwait | 99.8 /100 | #71 | Exceptional 2.1% |
| Immigrants | Spain | 99.8 /100 | #72 | Exceptional 2.1% |
| Immigrants | Bangladesh | 99.8 /100 | #73 | Exceptional 2.1% |
| Immigrants | Egypt | 99.8 /100 | #74 | Exceptional 2.1% |
| Immigrants | Sweden | 99.8 /100 | #75 | Exceptional 2.1% |
| Immigrants | Scotland | 99.8 /100 | #76 | Exceptional 2.1% |
| Immigrants | Saudi Arabia | 99.8 /100 | #77 | Exceptional 2.1% |
| Estonians | 99.7 /100 | #78 | Exceptional 2.1% |