Carpatho Rusyn vs Immigrants from Dominican Republic Births to Unmarried Women
COMPARE
Carpatho Rusyn
Immigrants from Dominican Republic
Births to Unmarried Women
Births to Unmarried Women Comparison
Carpatho Rusyns
Immigrants from Dominican Republic
30.9%
BIRTHS TO UNMARRIED WOMEN
73.5/ 100
METRIC RATING
156th/ 347
METRIC RANK
40.1%
BIRTHS TO UNMARRIED WOMEN
0.0/ 100
METRIC RATING
317th/ 347
METRIC RANK
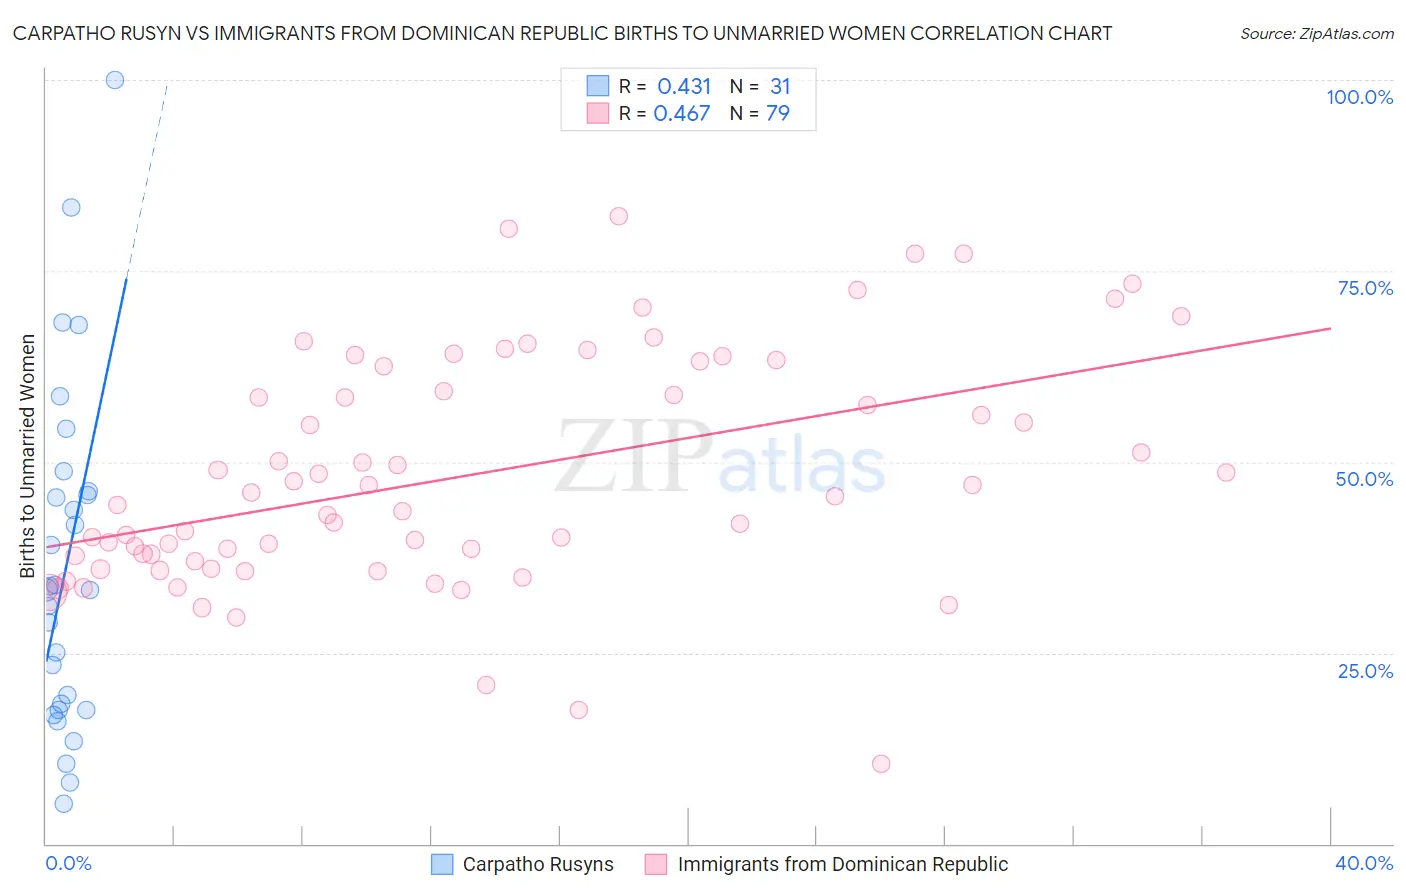
Carpatho Rusyn vs Immigrants from Dominican Republic Births to Unmarried Women Correlation Chart
The statistical analysis conducted on geographies consisting of 56,982,210 people shows a moderate positive correlation between the proportion of Carpatho Rusyns and percentage of births to unmarried women in the United States with a correlation coefficient (R) of 0.431 and weighted average of 30.9%. Similarly, the statistical analysis conducted on geographies consisting of 261,488,729 people shows a moderate positive correlation between the proportion of Immigrants from Dominican Republic and percentage of births to unmarried women in the United States with a correlation coefficient (R) of 0.467 and weighted average of 40.1%, a difference of 29.7%.
Births to Unmarried Women Correlation Summary
| Measurement | Carpatho Rusyn | Immigrants from Dominican Republic |
| Minimum | 5.2% | 10.4% |
| Maximum | 100.0% | 82.1% |
| Range | 94.8% | 71.7% |
| Mean | 36.4% | 48.2% |
| Median | 33.3% | 45.6% |
| Interquartile 25% (IQ1) | 17.5% | 37.1% |
| Interquartile 75% (IQ3) | 46.2% | 62.5% |
| Interquartile Range (IQR) | 28.7% | 25.4% |
| Standard Deviation (Sample) | 22.4% | 15.2% |
| Standard Deviation (Population) | 22.1% | 15.1% |
Similar Demographics by Births to Unmarried Women
Demographics Similar to Carpatho Rusyns by Births to Unmarried Women
In terms of births to unmarried women, the demographic groups most similar to Carpatho Rusyns are Immigrants from Bangladesh (30.9%, a difference of 0.050%), Immigrants from Eastern Africa (31.0%, a difference of 0.17%), Yugoslavian (30.8%, a difference of 0.20%), British (30.8%, a difference of 0.32%), and Polish (30.8%, a difference of 0.34%).
| Demographics | Rating | Rank | Births to Unmarried Women |
| Serbians | 78.8 /100 | #149 | Good 30.7% |
| Somalis | 77.8 /100 | #150 | Good 30.7% |
| Italians | 77.0 /100 | #151 | Good 30.8% |
| Poles | 76.2 /100 | #152 | Good 30.8% |
| British | 76.0 /100 | #153 | Good 30.8% |
| Yugoslavians | 75.1 /100 | #154 | Good 30.8% |
| Immigrants | Bangladesh | 73.9 /100 | #155 | Good 30.9% |
| Carpatho Rusyns | 73.5 /100 | #156 | Good 30.9% |
| Immigrants | Eastern Africa | 72.1 /100 | #157 | Good 31.0% |
| Austrians | 69.9 /100 | #158 | Good 31.0% |
| Immigrants | England | 69.4 /100 | #159 | Good 31.1% |
| Immigrants | Western Europe | 69.3 /100 | #160 | Good 31.1% |
| Immigrants | Southern Europe | 68.7 /100 | #161 | Good 31.1% |
| Slovenes | 65.9 /100 | #162 | Good 31.2% |
| Immigrants | Chile | 65.7 /100 | #163 | Good 31.2% |
Demographics Similar to Immigrants from Dominican Republic by Births to Unmarried Women
In terms of births to unmarried women, the demographic groups most similar to Immigrants from Dominican Republic are Immigrants from Bahamas (40.1%, a difference of 0.070%), Apache (39.9%, a difference of 0.55%), Dominican (39.8%, a difference of 0.61%), Yakama (40.3%, a difference of 0.62%), and Immigrants from Caribbean (39.8%, a difference of 0.65%).
| Demographics | Rating | Rank | Births to Unmarried Women |
| Immigrants | Dominica | 0.0 /100 | #310 | Tragic 39.5% |
| Immigrants | Azores | 0.0 /100 | #311 | Tragic 39.6% |
| U.S. Virgin Islanders | 0.0 /100 | #312 | Tragic 39.6% |
| Africans | 0.0 /100 | #313 | Tragic 39.7% |
| Immigrants | Caribbean | 0.0 /100 | #314 | Tragic 39.8% |
| Dominicans | 0.0 /100 | #315 | Tragic 39.8% |
| Apache | 0.0 /100 | #316 | Tragic 39.9% |
| Immigrants | Dominican Republic | 0.0 /100 | #317 | Tragic 40.1% |
| Immigrants | Bahamas | 0.0 /100 | #318 | Tragic 40.1% |
| Yakama | 0.0 /100 | #319 | Tragic 40.3% |
| Crow | 0.0 /100 | #320 | Tragic 40.4% |
| Bahamians | 0.0 /100 | #321 | Tragic 40.8% |
| Cajuns | 0.0 /100 | #322 | Tragic 41.0% |
| Sioux | 0.0 /100 | #323 | Tragic 41.0% |
| Cape Verdeans | 0.0 /100 | #324 | Tragic 41.3% |