Carpatho Rusyn vs Slavic Births to Unmarried Women
COMPARE
Carpatho Rusyn
Slavic
Births to Unmarried Women
Births to Unmarried Women Comparison
Carpatho Rusyns
Slavs
30.9%
BIRTHS TO UNMARRIED WOMEN
73.5/ 100
METRIC RATING
156th/ 347
METRIC RANK
31.6%
BIRTHS TO UNMARRIED WOMEN
52.0/ 100
METRIC RATING
169th/ 347
METRIC RANK
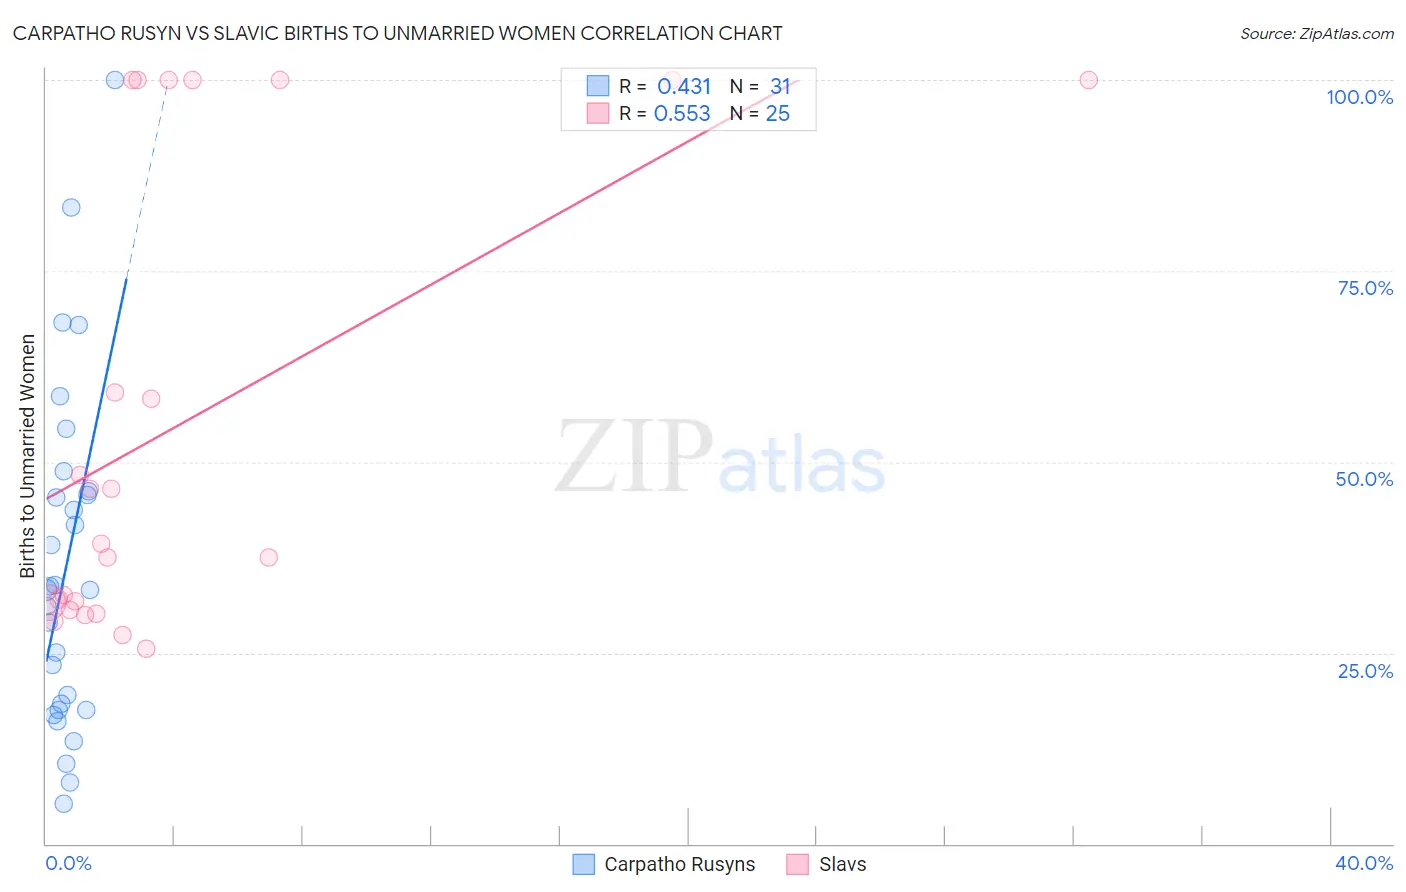
Carpatho Rusyn vs Slavic Births to Unmarried Women Correlation Chart
The statistical analysis conducted on geographies consisting of 56,982,210 people shows a moderate positive correlation between the proportion of Carpatho Rusyns and percentage of births to unmarried women in the United States with a correlation coefficient (R) of 0.431 and weighted average of 30.9%. Similarly, the statistical analysis conducted on geographies consisting of 254,358,438 people shows a substantial positive correlation between the proportion of Slavs and percentage of births to unmarried women in the United States with a correlation coefficient (R) of 0.553 and weighted average of 31.6%, a difference of 2.3%.
Births to Unmarried Women Correlation Summary
| Measurement | Carpatho Rusyn | Slavic |
| Minimum | 5.2% | 25.6% |
| Maximum | 100.0% | 100.0% |
| Range | 94.8% | 74.4% |
| Mean | 36.4% | 54.9% |
| Median | 33.3% | 39.3% |
| Interquartile 25% (IQ1) | 17.5% | 31.1% |
| Interquartile 75% (IQ3) | 46.2% | 100.0% |
| Interquartile Range (IQR) | 28.7% | 68.9% |
| Standard Deviation (Sample) | 22.4% | 29.9% |
| Standard Deviation (Population) | 22.1% | 29.3% |
Demographics Similar to Carpatho Rusyns and Slavs by Births to Unmarried Women
In terms of births to unmarried women, the demographic groups most similar to Carpatho Rusyns are Immigrants from Bangladesh (30.9%, a difference of 0.050%), Immigrants from Eastern Africa (31.0%, a difference of 0.17%), Yugoslavian (30.8%, a difference of 0.20%), British (30.8%, a difference of 0.32%), and Polish (30.8%, a difference of 0.34%). Similarly, the demographic groups most similar to Slavs are Belgian (31.6%, a difference of 0.030%), Guamanian/Chamorro (31.6%, a difference of 0.070%), Finnish (31.7%, a difference of 0.14%), Immigrants from Eritrea (31.7%, a difference of 0.15%), and Dutch (31.5%, a difference of 0.31%).
| Demographics | Rating | Rank | Births to Unmarried Women |
| Poles | 76.2 /100 | #152 | Good 30.8% |
| British | 76.0 /100 | #153 | Good 30.8% |
| Yugoslavians | 75.1 /100 | #154 | Good 30.8% |
| Immigrants | Bangladesh | 73.9 /100 | #155 | Good 30.9% |
| Carpatho Rusyns | 73.5 /100 | #156 | Good 30.9% |
| Immigrants | Eastern Africa | 72.1 /100 | #157 | Good 31.0% |
| Austrians | 69.9 /100 | #158 | Good 31.0% |
| Immigrants | England | 69.4 /100 | #159 | Good 31.1% |
| Immigrants | Western Europe | 69.3 /100 | #160 | Good 31.1% |
| Immigrants | Southern Europe | 68.7 /100 | #161 | Good 31.1% |
| Slovenes | 65.9 /100 | #162 | Good 31.2% |
| Immigrants | Chile | 65.7 /100 | #163 | Good 31.2% |
| Hungarians | 64.1 /100 | #164 | Good 31.2% |
| Immigrants | Somalia | 58.1 /100 | #165 | Average 31.4% |
| Peruvians | 55.5 /100 | #166 | Average 31.5% |
| Dutch | 55.3 /100 | #167 | Average 31.5% |
| Belgians | 52.4 /100 | #168 | Average 31.6% |
| Slavs | 52.0 /100 | #169 | Average 31.6% |
| Guamanians/Chamorros | 51.3 /100 | #170 | Average 31.6% |
| Finns | 50.5 /100 | #171 | Average 31.7% |
| Immigrants | Eritrea | 50.4 /100 | #172 | Average 31.7% |