Carpatho Rusyn vs Assyrian/Chaldean/Syriac Family Households
COMPARE
Carpatho Rusyn
Assyrian/Chaldean/Syriac
Family Households
Family Households Comparison
Carpatho Rusyns
Assyrians/Chaldeans/Syriacs
61.1%
FAMILY HOUSEHOLDS
0.0/ 100
METRIC RATING
335th/ 347
METRIC RANK
68.2%
FAMILY HOUSEHOLDS
100.0/ 100
METRIC RATING
15th/ 347
METRIC RANK
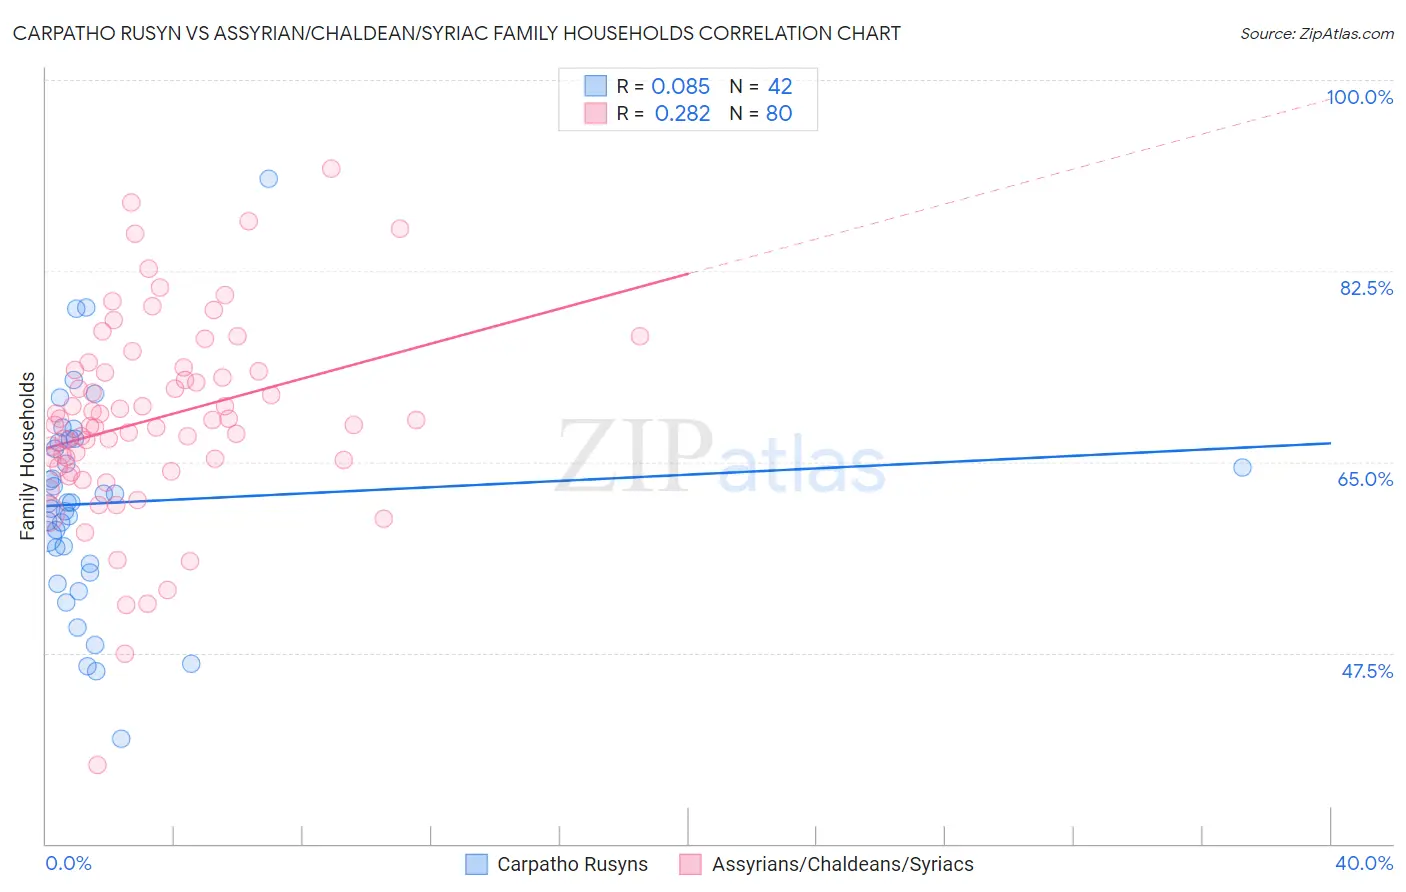
Carpatho Rusyn vs Assyrian/Chaldean/Syriac Family Households Correlation Chart
The statistical analysis conducted on geographies consisting of 58,871,690 people shows a slight positive correlation between the proportion of Carpatho Rusyns and percentage of family households in the United States with a correlation coefficient (R) of 0.085 and weighted average of 61.1%. Similarly, the statistical analysis conducted on geographies consisting of 110,294,582 people shows a weak positive correlation between the proportion of Assyrians/Chaldeans/Syriacs and percentage of family households in the United States with a correlation coefficient (R) of 0.282 and weighted average of 68.2%, a difference of 11.6%.
Family Households Correlation Summary
| Measurement | Carpatho Rusyn | Assyrian/Chaldean/Syriac |
| Minimum | 39.6% | 37.2% |
| Maximum | 91.0% | 91.9% |
| Range | 51.3% | 54.6% |
| Mean | 61.2% | 69.0% |
| Median | 61.2% | 68.6% |
| Interquartile 25% (IQ1) | 55.7% | 64.9% |
| Interquartile 75% (IQ3) | 66.8% | 73.4% |
| Interquartile Range (IQR) | 11.1% | 8.5% |
| Standard Deviation (Sample) | 9.7% | 9.1% |
| Standard Deviation (Population) | 9.6% | 9.0% |
Similar Demographics by Family Households
Demographics Similar to Carpatho Rusyns by Family Households
In terms of family households, the demographic groups most similar to Carpatho Rusyns are Immigrants from Eastern Africa (61.1%, a difference of 0.12%), Immigrants from Ethiopia (61.2%, a difference of 0.20%), Ethiopian (61.2%, a difference of 0.28%), German Russian (60.9%, a difference of 0.28%), and Soviet Union (60.9%, a difference of 0.28%).
| Demographics | Rating | Rank | Family Households |
| Kiowa | 0.0 /100 | #328 | Tragic 61.4% |
| Cambodians | 0.0 /100 | #329 | Tragic 61.4% |
| Immigrants | Australia | 0.0 /100 | #330 | Tragic 61.3% |
| Immigrants | France | 0.0 /100 | #331 | Tragic 61.3% |
| Ethiopians | 0.0 /100 | #332 | Tragic 61.2% |
| Immigrants | Ethiopia | 0.0 /100 | #333 | Tragic 61.2% |
| Immigrants | Eastern Africa | 0.0 /100 | #334 | Tragic 61.1% |
| Carpatho Rusyns | 0.0 /100 | #335 | Tragic 61.1% |
| German Russians | 0.0 /100 | #336 | Tragic 60.9% |
| Soviet Union | 0.0 /100 | #337 | Tragic 60.9% |
| Immigrants | Eritrea | 0.0 /100 | #338 | Tragic 60.8% |
| Immigrants | Saudi Arabia | 0.0 /100 | #339 | Tragic 60.7% |
| Immigrants | Sudan | 0.0 /100 | #340 | Tragic 60.2% |
| Immigrants | Senegal | 0.0 /100 | #341 | Tragic 60.1% |
| Sudanese | 0.0 /100 | #342 | Tragic 60.0% |
Demographics Similar to Assyrians/Chaldeans/Syriacs by Family Households
In terms of family households, the demographic groups most similar to Assyrians/Chaldeans/Syriacs are Immigrants from Vietnam (68.2%, a difference of 0.0%), Chinese (68.1%, a difference of 0.040%), Immigrants from Cuba (68.2%, a difference of 0.060%), Pueblo (68.2%, a difference of 0.070%), and Korean (68.3%, a difference of 0.15%).
| Demographics | Rating | Rank | Family Households |
| Immigrants | Fiji | 100.0 /100 | #8 | Exceptional 68.8% |
| Native Hawaiians | 100.0 /100 | #9 | Exceptional 68.4% |
| Immigrants | Philippines | 100.0 /100 | #10 | Exceptional 68.3% |
| Immigrants | Central America | 100.0 /100 | #11 | Exceptional 68.3% |
| Koreans | 100.0 /100 | #12 | Exceptional 68.3% |
| Pueblo | 100.0 /100 | #13 | Exceptional 68.2% |
| Immigrants | Cuba | 100.0 /100 | #14 | Exceptional 68.2% |
| Assyrians/Chaldeans/Syriacs | 100.0 /100 | #15 | Exceptional 68.2% |
| Immigrants | Vietnam | 100.0 /100 | #16 | Exceptional 68.2% |
| Chinese | 100.0 /100 | #17 | Exceptional 68.1% |
| Immigrants | Taiwan | 100.0 /100 | #18 | Exceptional 68.0% |
| Samoans | 100.0 /100 | #19 | Exceptional 67.9% |
| Inupiat | 100.0 /100 | #20 | Exceptional 67.8% |
| Cubans | 100.0 /100 | #21 | Exceptional 67.7% |
| Sri Lankans | 100.0 /100 | #22 | Exceptional 67.7% |