Carpatho Rusyn vs Immigrants from Kenya Unemployment Among Ages 60 to 64 years
COMPARE
Carpatho Rusyn
Immigrants from Kenya
Unemployment Among Ages 60 to 64 years
Unemployment Among Ages 60 to 64 years Comparison
Carpatho Rusyns
Immigrants from Kenya
4.5%
UNEMPLOYMENT AMONG AGES 60 TO 64 YEARS
100.0/ 100
METRIC RATING
33rd/ 347
METRIC RANK
4.6%
UNEMPLOYMENT AMONG AGES 60 TO 64 YEARS
99.9/ 100
METRIC RATING
51st/ 347
METRIC RANK
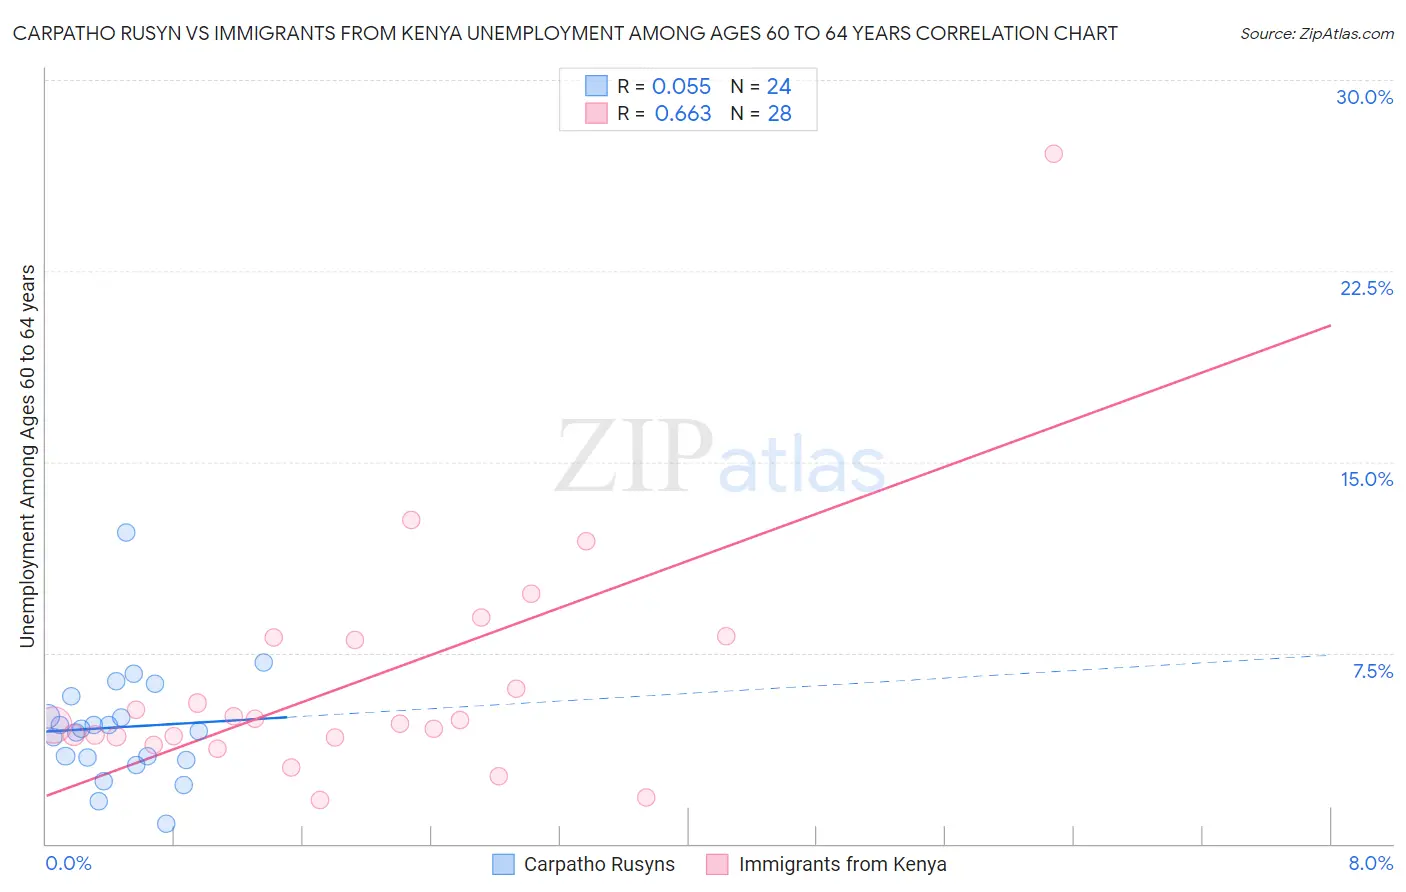
Carpatho Rusyn vs Immigrants from Kenya Unemployment Among Ages 60 to 64 years Correlation Chart
The statistical analysis conducted on geographies consisting of 57,468,302 people shows a slight positive correlation between the proportion of Carpatho Rusyns and unemployment rate among population between the ages 60 and 64 in the United States with a correlation coefficient (R) of 0.055 and weighted average of 4.5%. Similarly, the statistical analysis conducted on geographies consisting of 206,328,439 people shows a significant positive correlation between the proportion of Immigrants from Kenya and unemployment rate among population between the ages 60 and 64 in the United States with a correlation coefficient (R) of 0.663 and weighted average of 4.6%, a difference of 2.0%.
Unemployment Among Ages 60 to 64 years Correlation Summary
| Measurement | Carpatho Rusyn | Immigrants from Kenya |
| Minimum | 0.80% | 1.7% |
| Maximum | 12.2% | 27.1% |
| Range | 11.4% | 25.4% |
| Mean | 4.6% | 6.4% |
| Median | 4.5% | 4.8% |
| Interquartile 25% (IQ1) | 3.3% | 4.2% |
| Interquartile 75% (IQ3) | 5.4% | 8.1% |
| Interquartile Range (IQR) | 2.0% | 3.9% |
| Standard Deviation (Sample) | 2.3% | 4.9% |
| Standard Deviation (Population) | 2.2% | 4.8% |
Demographics Similar to Carpatho Rusyns and Immigrants from Kenya by Unemployment Among Ages 60 to 64 years
In terms of unemployment among ages 60 to 64 years, the demographic groups most similar to Carpatho Rusyns are Zimbabwean (4.5%, a difference of 0.050%), Belgian (4.5%, a difference of 0.26%), German (4.5%, a difference of 0.28%), Venezuelan (4.5%, a difference of 0.29%), and Immigrants from Portugal (4.5%, a difference of 0.32%). Similarly, the demographic groups most similar to Immigrants from Kenya are Kenyan (4.6%, a difference of 0.010%), Scottish (4.6%, a difference of 0.11%), Scotch-Irish (4.6%, a difference of 0.15%), Immigrants from Zimbabwe (4.6%, a difference of 0.20%), and Assyrian/Chaldean/Syriac (4.5%, a difference of 0.42%).
| Demographics | Rating | Rank | Unemployment Among Ages 60 to 64 years |
| Zimbabweans | 100.0 /100 | #32 | Exceptional 4.5% |
| Carpatho Rusyns | 100.0 /100 | #33 | Exceptional 4.5% |
| Belgians | 100.0 /100 | #34 | Exceptional 4.5% |
| Germans | 100.0 /100 | #35 | Exceptional 4.5% |
| Venezuelans | 100.0 /100 | #36 | Exceptional 4.5% |
| Immigrants | Portugal | 100.0 /100 | #37 | Exceptional 4.5% |
| Native Hawaiians | 100.0 /100 | #38 | Exceptional 4.5% |
| Iraqis | 100.0 /100 | #39 | Exceptional 4.5% |
| Scandinavians | 100.0 /100 | #40 | Exceptional 4.5% |
| Immigrants | Sudan | 100.0 /100 | #41 | Exceptional 4.5% |
| English | 100.0 /100 | #42 | Exceptional 4.5% |
| Swedes | 100.0 /100 | #43 | Exceptional 4.5% |
| Europeans | 100.0 /100 | #44 | Exceptional 4.5% |
| Liberians | 99.9 /100 | #45 | Exceptional 4.5% |
| Bhutanese | 99.9 /100 | #46 | Exceptional 4.5% |
| Assyrians/Chaldeans/Syriacs | 99.9 /100 | #47 | Exceptional 4.5% |
| Immigrants | Zimbabwe | 99.9 /100 | #48 | Exceptional 4.6% |
| Scotch-Irish | 99.9 /100 | #49 | Exceptional 4.6% |
| Scottish | 99.9 /100 | #50 | Exceptional 4.6% |
| Immigrants | Kenya | 99.9 /100 | #51 | Exceptional 4.6% |
| Kenyans | 99.9 /100 | #52 | Exceptional 4.6% |