Carpatho Rusyn vs Immigrants from Southern Europe Currently Married
COMPARE
Carpatho Rusyn
Immigrants from Southern Europe
Currently Married
Currently Married Comparison
Carpatho Rusyns
Immigrants from Southern Europe
47.0%
CURRENTLY MARRIED
72.6/ 100
METRIC RATING
146th/ 347
METRIC RANK
46.9%
CURRENTLY MARRIED
65.9/ 100
METRIC RATING
161st/ 347
METRIC RANK
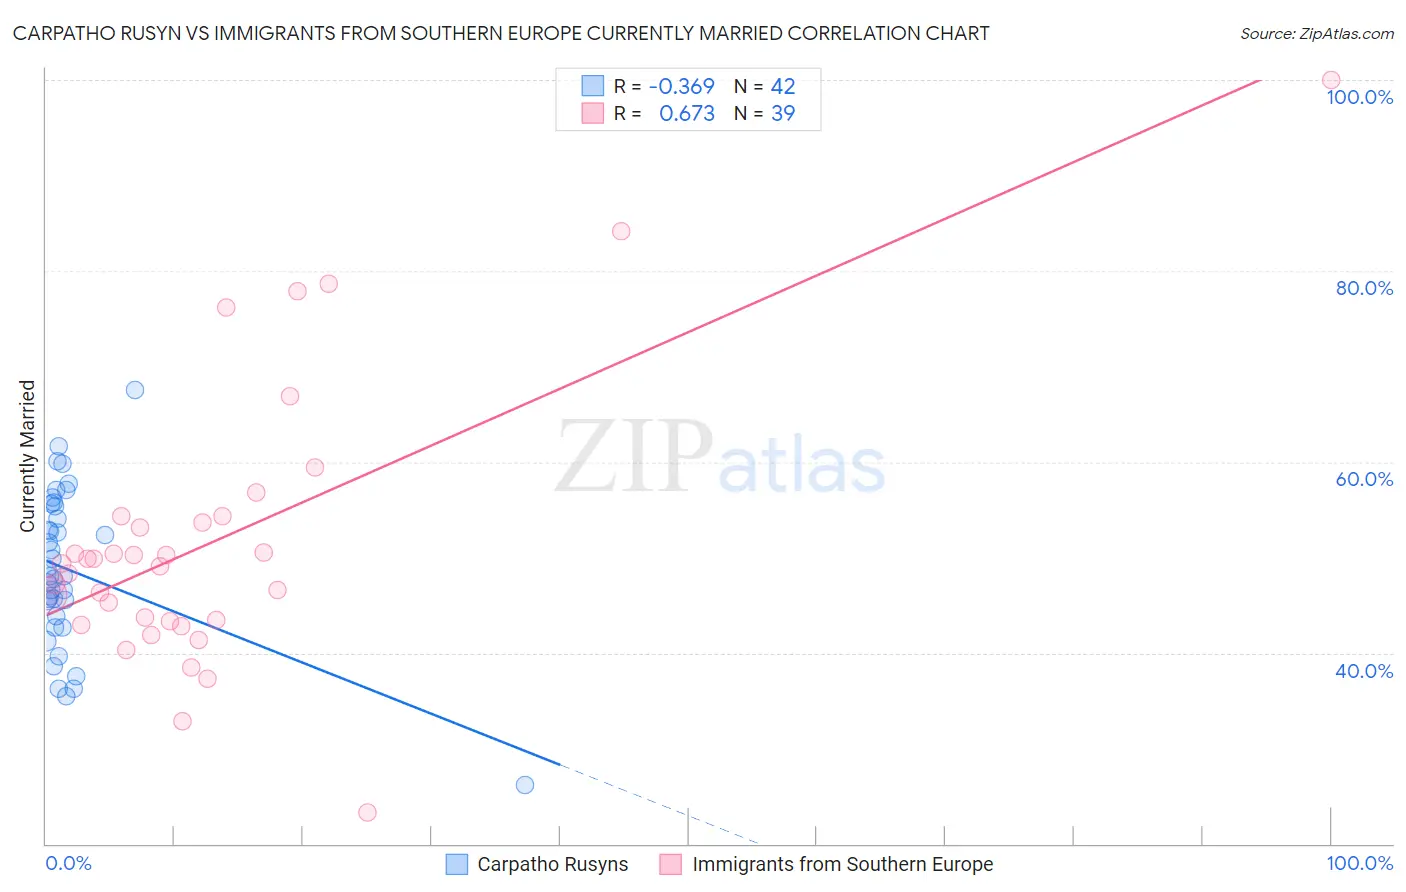
Carpatho Rusyn vs Immigrants from Southern Europe Currently Married Correlation Chart
The statistical analysis conducted on geographies consisting of 58,871,690 people shows a mild negative correlation between the proportion of Carpatho Rusyns and percentage of population currently married in the United States with a correlation coefficient (R) of -0.369 and weighted average of 47.0%. Similarly, the statistical analysis conducted on geographies consisting of 402,740,991 people shows a significant positive correlation between the proportion of Immigrants from Southern Europe and percentage of population currently married in the United States with a correlation coefficient (R) of 0.673 and weighted average of 46.9%, a difference of 0.29%.
Currently Married Correlation Summary
| Measurement | Carpatho Rusyn | Immigrants from Southern Europe |
| Minimum | 26.2% | 23.3% |
| Maximum | 67.5% | 100.0% |
| Range | 41.3% | 76.7% |
| Mean | 48.6% | 51.7% |
| Median | 48.0% | 49.3% |
| Interquartile 25% (IQ1) | 43.8% | 43.3% |
| Interquartile 75% (IQ3) | 55.3% | 54.2% |
| Interquartile Range (IQR) | 11.5% | 10.9% |
| Standard Deviation (Sample) | 8.3% | 14.7% |
| Standard Deviation (Population) | 8.2% | 14.5% |
Demographics Similar to Carpatho Rusyns and Immigrants from Southern Europe by Currently Married
In terms of currently married, the demographic groups most similar to Carpatho Rusyns are Immigrants from South Eastern Asia (47.1%, a difference of 0.010%), Immigrants from Argentina (47.0%, a difference of 0.030%), Hmong (47.1%, a difference of 0.040%), Guamanian/Chamorro (47.1%, a difference of 0.070%), and Cambodian (47.0%, a difference of 0.10%). Similarly, the demographic groups most similar to Immigrants from Southern Europe are Immigrants from Uzbekistan (46.9%, a difference of 0.0%), Iraqi (46.9%, a difference of 0.020%), Nonimmigrants (46.9%, a difference of 0.020%), Cherokee (46.9%, a difference of 0.030%), and Delaware (46.9%, a difference of 0.050%).
| Demographics | Rating | Rank | Currently Married |
| Guamanians/Chamorros | 74.2 /100 | #143 | Good 47.1% |
| Hmong | 73.4 /100 | #144 | Good 47.1% |
| Immigrants | South Eastern Asia | 72.9 /100 | #145 | Good 47.1% |
| Carpatho Rusyns | 72.6 /100 | #146 | Good 47.0% |
| Immigrants | Argentina | 72.0 /100 | #147 | Good 47.0% |
| Cambodians | 70.4 /100 | #148 | Good 47.0% |
| Zimbabweans | 70.1 /100 | #149 | Good 47.0% |
| Immigrants | Turkey | 70.0 /100 | #150 | Good 47.0% |
| Chileans | 69.8 /100 | #151 | Good 47.0% |
| Immigrants | Serbia | 68.8 /100 | #152 | Good 47.0% |
| Immigrants | Venezuela | 68.6 /100 | #153 | Good 47.0% |
| Albanians | 68.6 /100 | #154 | Good 47.0% |
| Arabs | 68.6 /100 | #155 | Good 47.0% |
| Spanish | 68.1 /100 | #156 | Good 47.0% |
| Immigrants | Switzerland | 67.8 /100 | #157 | Good 46.9% |
| Cherokee | 66.8 /100 | #158 | Good 46.9% |
| Iraqis | 66.4 /100 | #159 | Good 46.9% |
| Immigrants | Uzbekistan | 66.0 /100 | #160 | Good 46.9% |
| Immigrants | Southern Europe | 65.9 /100 | #161 | Good 46.9% |
| Immigrants | Nonimmigrants | 65.4 /100 | #162 | Good 46.9% |
| Delaware | 64.7 /100 | #163 | Good 46.9% |