Canadian vs Immigrants from Fiji 2nd Grade
COMPARE
Canadian
Immigrants from Fiji
2nd Grade
2nd Grade Comparison
Canadians
Immigrants from Fiji
98.3%
2ND GRADE
99.7/ 100
METRIC RATING
66th/ 347
METRIC RANK
96.4%
2ND GRADE
0.0/ 100
METRIC RATING
336th/ 347
METRIC RANK
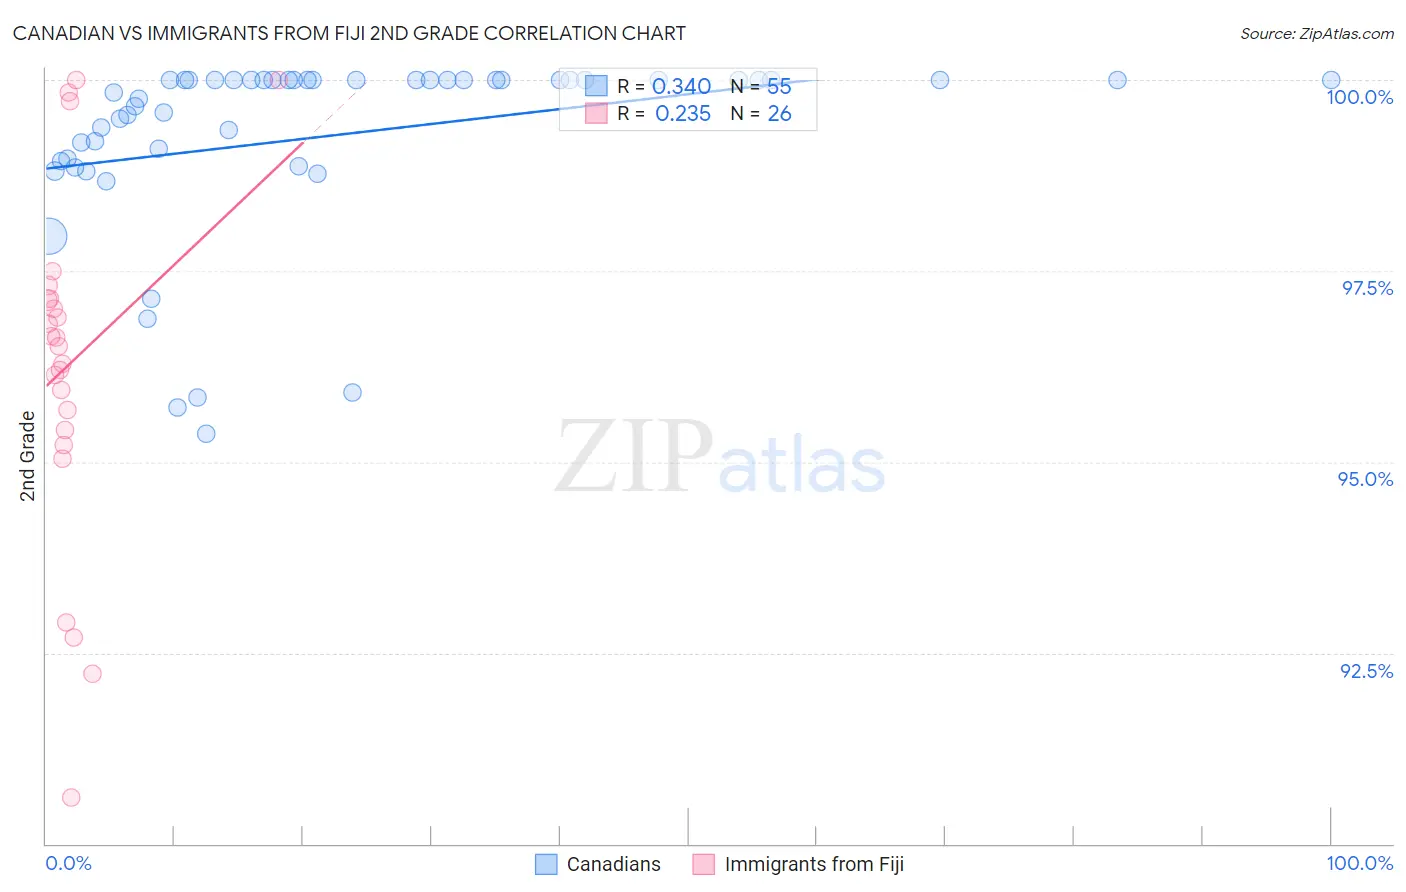
Canadian vs Immigrants from Fiji 2nd Grade Correlation Chart
The statistical analysis conducted on geographies consisting of 437,557,033 people shows a mild positive correlation between the proportion of Canadians and percentage of population with at least 2nd grade education in the United States with a correlation coefficient (R) of 0.340 and weighted average of 98.3%. Similarly, the statistical analysis conducted on geographies consisting of 93,756,204 people shows a weak positive correlation between the proportion of Immigrants from Fiji and percentage of population with at least 2nd grade education in the United States with a correlation coefficient (R) of 0.235 and weighted average of 96.4%, a difference of 2.0%.
2nd Grade Correlation Summary
| Measurement | Canadian | Immigrants from Fiji |
| Minimum | 95.4% | 90.6% |
| Maximum | 100.0% | 100.0% |
| Range | 4.6% | 9.4% |
| Mean | 99.3% | 96.3% |
| Median | 100.0% | 96.6% |
| Interquartile 25% (IQ1) | 98.9% | 95.4% |
| Interquartile 75% (IQ3) | 100.0% | 97.1% |
| Interquartile Range (IQR) | 1.1% | 1.7% |
| Standard Deviation (Sample) | 1.2% | 2.3% |
| Standard Deviation (Population) | 1.2% | 2.3% |
Similar Demographics by 2nd Grade
Demographics Similar to Canadians by 2nd Grade
In terms of 2nd grade, the demographic groups most similar to Canadians are Immigrants from Northern Europe (98.3%, a difference of 0.0%), Russian (98.3%, a difference of 0.0%), New Zealander (98.3%, a difference of 0.010%), Immigrants from Austria (98.3%, a difference of 0.010%), and Serbian (98.3%, a difference of 0.010%).
| Demographics | Rating | Rank | 2nd Grade |
| Slavs | 99.8 /100 | #59 | Exceptional 98.3% |
| Creek | 99.8 /100 | #60 | Exceptional 98.3% |
| Immigrants | Canada | 99.8 /100 | #61 | Exceptional 98.3% |
| Greeks | 99.8 /100 | #62 | Exceptional 98.3% |
| Maltese | 99.7 /100 | #63 | Exceptional 98.3% |
| Immigrants | North America | 99.7 /100 | #64 | Exceptional 98.3% |
| New Zealanders | 99.7 /100 | #65 | Exceptional 98.3% |
| Canadians | 99.7 /100 | #66 | Exceptional 98.3% |
| Immigrants | Northern Europe | 99.7 /100 | #67 | Exceptional 98.3% |
| Russians | 99.7 /100 | #68 | Exceptional 98.3% |
| Immigrants | Austria | 99.6 /100 | #69 | Exceptional 98.3% |
| Serbians | 99.6 /100 | #70 | Exceptional 98.3% |
| Chickasaw | 99.6 /100 | #71 | Exceptional 98.3% |
| Cheyenne | 99.6 /100 | #72 | Exceptional 98.3% |
| Cajuns | 99.5 /100 | #73 | Exceptional 98.3% |
Demographics Similar to Immigrants from Fiji by 2nd Grade
In terms of 2nd grade, the demographic groups most similar to Immigrants from Fiji are Yakama (96.4%, a difference of 0.010%), Immigrants from Cambodia (96.4%, a difference of 0.010%), Central American (96.4%, a difference of 0.020%), Immigrants from Cabo Verde (96.3%, a difference of 0.030%), and Immigrants from Dominican Republic (96.4%, a difference of 0.040%).
| Demographics | Rating | Rank | 2nd Grade |
| Japanese | 0.0 /100 | #329 | Tragic 96.5% |
| Immigrants | Latin America | 0.0 /100 | #330 | Tragic 96.5% |
| Immigrants | Armenia | 0.0 /100 | #331 | Tragic 96.5% |
| Bangladeshis | 0.0 /100 | #332 | Tragic 96.5% |
| Immigrants | Dominican Republic | 0.0 /100 | #333 | Tragic 96.4% |
| Central Americans | 0.0 /100 | #334 | Tragic 96.4% |
| Yakama | 0.0 /100 | #335 | Tragic 96.4% |
| Immigrants | Fiji | 0.0 /100 | #336 | Tragic 96.4% |
| Immigrants | Cambodia | 0.0 /100 | #337 | Tragic 96.4% |
| Immigrants | Cabo Verde | 0.0 /100 | #338 | Tragic 96.3% |
| Guatemalans | 0.0 /100 | #339 | Tragic 96.3% |
| Immigrants | Guatemala | 0.0 /100 | #340 | Tragic 96.2% |
| Immigrants | Central America | 0.0 /100 | #341 | Tragic 96.2% |
| Immigrants | Mexico | 0.0 /100 | #342 | Tragic 96.1% |
| Nepalese | 0.0 /100 | #343 | Tragic 96.1% |