Immigrants from Uzbekistan vs Immigrants from Lithuania Single Father Households
COMPARE
Immigrants from Uzbekistan
Immigrants from Lithuania
Single Father Households
Single Father Households Comparison
Immigrants from Uzbekistan
Immigrants from Lithuania
1.8%
SINGLE FATHER HOUSEHOLDS
100.0/ 100
METRIC RATING
4th/ 347
METRIC RANK
1.9%
SINGLE FATHER HOUSEHOLDS
100.0/ 100
METRIC RATING
14th/ 347
METRIC RANK
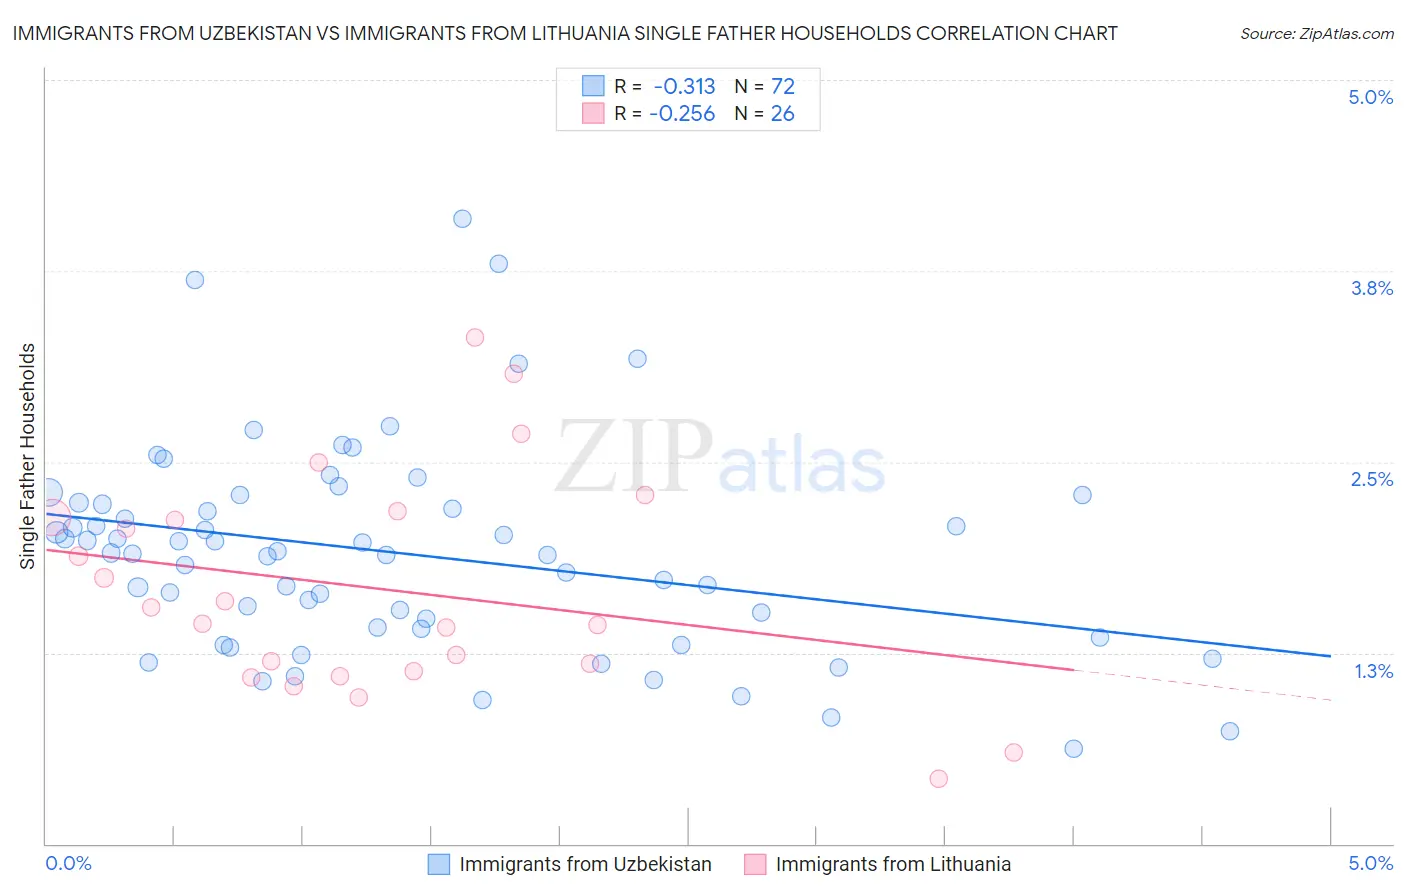
Immigrants from Uzbekistan vs Immigrants from Lithuania Single Father Households Correlation Chart
The statistical analysis conducted on geographies consisting of 118,416,914 people shows a mild negative correlation between the proportion of Immigrants from Uzbekistan and percentage of single father households in the United States with a correlation coefficient (R) of -0.313 and weighted average of 1.8%. Similarly, the statistical analysis conducted on geographies consisting of 117,396,779 people shows a weak negative correlation between the proportion of Immigrants from Lithuania and percentage of single father households in the United States with a correlation coefficient (R) of -0.256 and weighted average of 1.9%, a difference of 3.9%.
Single Father Households Correlation Summary
| Measurement | Immigrants from Uzbekistan | Immigrants from Lithuania |
| Minimum | 0.62% | 0.43% |
| Maximum | 4.1% | 3.3% |
| Range | 3.5% | 2.9% |
| Mean | 1.9% | 1.7% |
| Median | 1.9% | 1.5% |
| Interquartile 25% (IQ1) | 1.4% | 1.1% |
| Interquartile 75% (IQ3) | 2.2% | 2.1% |
| Interquartile Range (IQR) | 0.82% | 1.0% |
| Standard Deviation (Sample) | 0.68% | 0.72% |
| Standard Deviation (Population) | 0.68% | 0.71% |
Demographics Similar to Immigrants from Uzbekistan and Immigrants from Lithuania by Single Father Households
In terms of single father households, the demographic groups most similar to Immigrants from Uzbekistan are Filipino (1.8%, a difference of 0.66%), Immigrants from Hong Kong (1.8%, a difference of 0.94%), Immigrants from Israel (1.8%, a difference of 1.1%), Soviet Union (1.8%, a difference of 1.1%), and Immigrants from Taiwan (1.8%, a difference of 1.3%). Similarly, the demographic groups most similar to Immigrants from Lithuania are Immigrants from Eastern Asia (1.9%, a difference of 0.15%), Immigrants from Iran (1.9%, a difference of 0.35%), Immigrants from India (1.9%, a difference of 0.58%), Immigrants from Singapore (1.9%, a difference of 0.98%), and Immigrants from Greece (1.9%, a difference of 1.0%).
| Demographics | Rating | Rank | Single Father Households |
| Soviet Union | 100.0 /100 | #1 | Exceptional 1.8% |
| Immigrants | Israel | 100.0 /100 | #2 | Exceptional 1.8% |
| Filipinos | 100.0 /100 | #3 | Exceptional 1.8% |
| Immigrants | Uzbekistan | 100.0 /100 | #4 | Exceptional 1.8% |
| Immigrants | Hong Kong | 100.0 /100 | #5 | Exceptional 1.8% |
| Immigrants | Taiwan | 100.0 /100 | #6 | Exceptional 1.8% |
| Cypriots | 100.0 /100 | #7 | Exceptional 1.8% |
| Immigrants | Ireland | 100.0 /100 | #8 | Exceptional 1.8% |
| Immigrants | China | 100.0 /100 | #9 | Exceptional 1.8% |
| Okinawans | 100.0 /100 | #10 | Exceptional 1.9% |
| Immigrants | Belarus | 100.0 /100 | #11 | Exceptional 1.9% |
| Immigrants | Greece | 100.0 /100 | #12 | Exceptional 1.9% |
| Immigrants | Singapore | 100.0 /100 | #13 | Exceptional 1.9% |
| Immigrants | Lithuania | 100.0 /100 | #14 | Exceptional 1.9% |
| Immigrants | Eastern Asia | 100.0 /100 | #15 | Exceptional 1.9% |
| Immigrants | Iran | 100.0 /100 | #16 | Exceptional 1.9% |
| Immigrants | India | 100.0 /100 | #17 | Exceptional 1.9% |
| Indians (Asian) | 100.0 /100 | #18 | Exceptional 1.9% |
| Iranians | 100.0 /100 | #19 | Exceptional 1.9% |
| Thais | 100.0 /100 | #20 | Exceptional 1.9% |