Nicaraguan vs Arab Average Family Size
COMPARE
Nicaraguan
Arab
Average Family Size
Average Family Size Comparison
Nicaraguans
Arabs
3.36
AVERAGE FAMILY SIZE
100.0/ 100
METRIC RATING
51st/ 347
METRIC RANK
3.23
AVERAGE FAMILY SIZE
53.8/ 100
METRIC RATING
170th/ 347
METRIC RANK
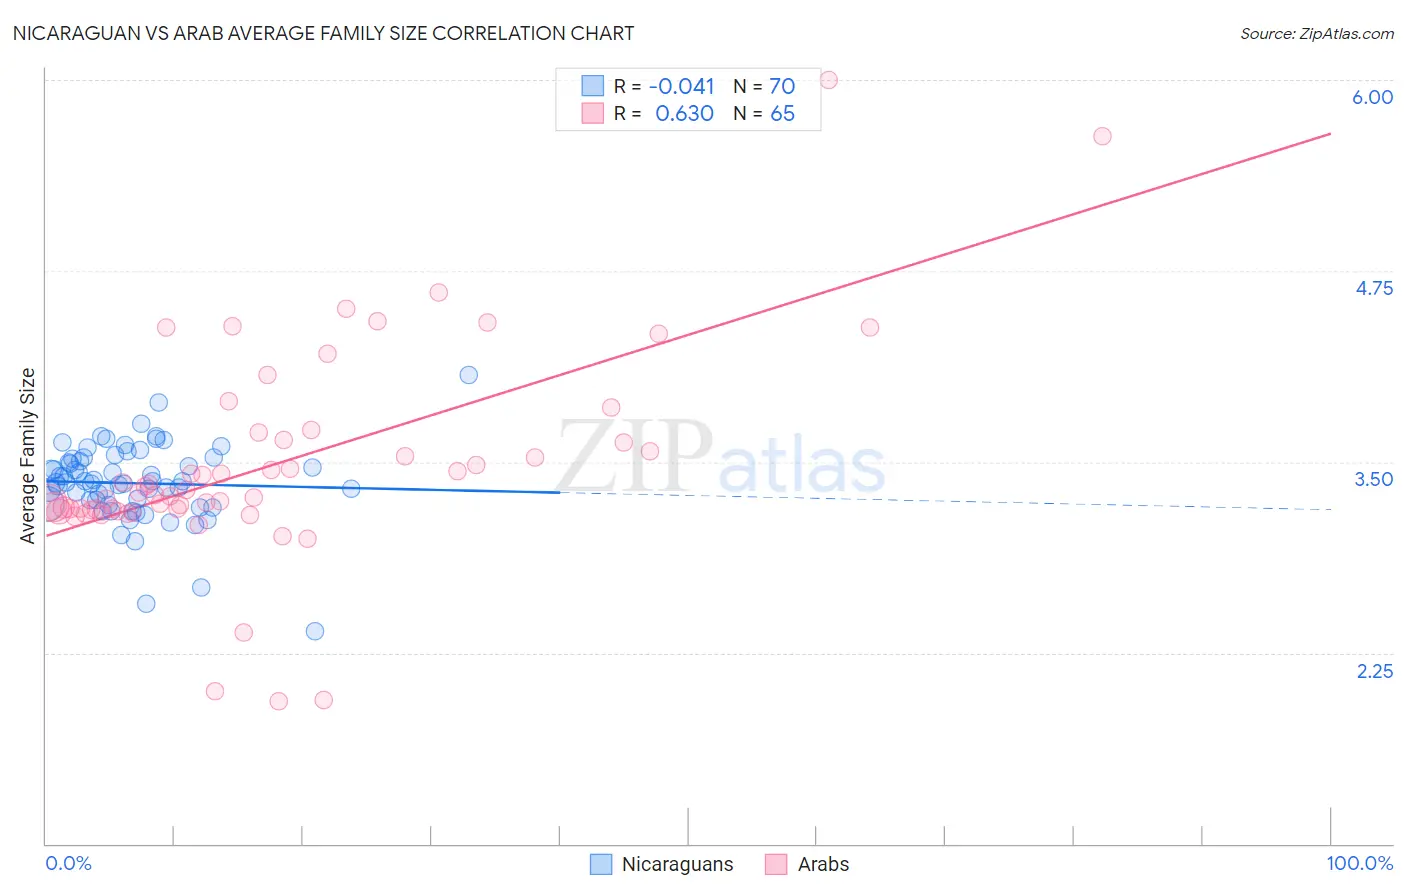
Nicaraguan vs Arab Average Family Size Correlation Chart
The statistical analysis conducted on geographies consisting of 285,625,461 people shows no correlation between the proportion of Nicaraguans and average family size in the United States with a correlation coefficient (R) of -0.041 and weighted average of 3.36. Similarly, the statistical analysis conducted on geographies consisting of 486,389,490 people shows a significant positive correlation between the proportion of Arabs and average family size in the United States with a correlation coefficient (R) of 0.630 and weighted average of 3.23, a difference of 4.0%.
Average Family Size Correlation Summary
| Measurement | Nicaraguan | Arab |
| Minimum | 2.39 | 1.93 |
| Maximum | 4.07 | 6.00 |
| Range | 1.68 | 4.07 |
| Mean | 3.36 | 3.49 |
| Median | 3.37 | 3.30 |
| Interquartile 25% (IQ1) | 3.22 | 3.19 |
| Interquartile 75% (IQ3) | 3.52 | 3.67 |
| Interquartile Range (IQR) | 0.30 | 0.48 |
| Standard Deviation (Sample) | 0.26 | 0.69 |
| Standard Deviation (Population) | 0.26 | 0.68 |
Similar Demographics by Average Family Size
Demographics Similar to Nicaraguans by Average Family Size
In terms of average family size, the demographic groups most similar to Nicaraguans are Fijian (3.36, a difference of 0.050%), Immigrants from Bangladesh (3.36, a difference of 0.070%), Korean (3.36, a difference of 0.090%), Immigrants from South Eastern Asia (3.36, a difference of 0.10%), and Immigrants from Honduras (3.36, a difference of 0.14%).
| Demographics | Rating | Rank | Average Family Size |
| Alaska Natives | 100.0 /100 | #44 | Exceptional 3.37 |
| Shoshone | 100.0 /100 | #45 | Exceptional 3.37 |
| Haitians | 100.0 /100 | #46 | Exceptional 3.37 |
| Vietnamese | 100.0 /100 | #47 | Exceptional 3.37 |
| Immigrants | Nicaragua | 100.0 /100 | #48 | Exceptional 3.37 |
| Bangladeshis | 100.0 /100 | #49 | Exceptional 3.37 |
| Immigrants | Bangladesh | 100.0 /100 | #50 | Exceptional 3.36 |
| Nicaraguans | 100.0 /100 | #51 | Exceptional 3.36 |
| Fijians | 100.0 /100 | #52 | Exceptional 3.36 |
| Koreans | 100.0 /100 | #53 | Exceptional 3.36 |
| Immigrants | South Eastern Asia | 100.0 /100 | #54 | Exceptional 3.36 |
| Immigrants | Honduras | 100.0 /100 | #55 | Exceptional 3.36 |
| Immigrants | Dominican Republic | 100.0 /100 | #56 | Exceptional 3.35 |
| Sri Lankans | 100.0 /100 | #57 | Exceptional 3.35 |
| Hondurans | 100.0 /100 | #58 | Exceptional 3.35 |
Demographics Similar to Arabs by Average Family Size
In terms of average family size, the demographic groups most similar to Arabs are Taiwanese (3.23, a difference of 0.010%), Aleut (3.23, a difference of 0.010%), Chilean (3.23, a difference of 0.010%), Immigrants from Congo (3.23, a difference of 0.020%), and Immigrants from Uruguay (3.23, a difference of 0.030%).
| Demographics | Rating | Rank | Average Family Size |
| Uruguayans | 58.8 /100 | #163 | Average 3.23 |
| Egyptians | 58.6 /100 | #164 | Average 3.23 |
| Ugandans | 58.4 /100 | #165 | Average 3.23 |
| Immigrants | Senegal | 57.5 /100 | #166 | Average 3.23 |
| Dutch West Indians | 56.9 /100 | #167 | Average 3.23 |
| Taiwanese | 54.2 /100 | #168 | Average 3.23 |
| Aleuts | 54.1 /100 | #169 | Average 3.23 |
| Arabs | 53.8 /100 | #170 | Average 3.23 |
| Chileans | 53.2 /100 | #171 | Average 3.23 |
| Immigrants | Congo | 52.7 /100 | #172 | Average 3.23 |
| Immigrants | Uruguay | 52.0 /100 | #173 | Average 3.23 |
| Immigrants | South Central Asia | 50.0 /100 | #174 | Average 3.23 |
| Immigrants | China | 49.9 /100 | #175 | Average 3.23 |
| Israelis | 48.7 /100 | #176 | Average 3.23 |
| Argentineans | 47.4 /100 | #177 | Average 3.23 |