Creek vs Arab Average Family Size
COMPARE
Creek
Arab
Average Family Size
Average Family Size Comparison
Creek
Arabs
3.20
AVERAGE FAMILY SIZE
12.1/ 100
METRIC RATING
212th/ 347
METRIC RANK
3.23
AVERAGE FAMILY SIZE
53.8/ 100
METRIC RATING
170th/ 347
METRIC RANK
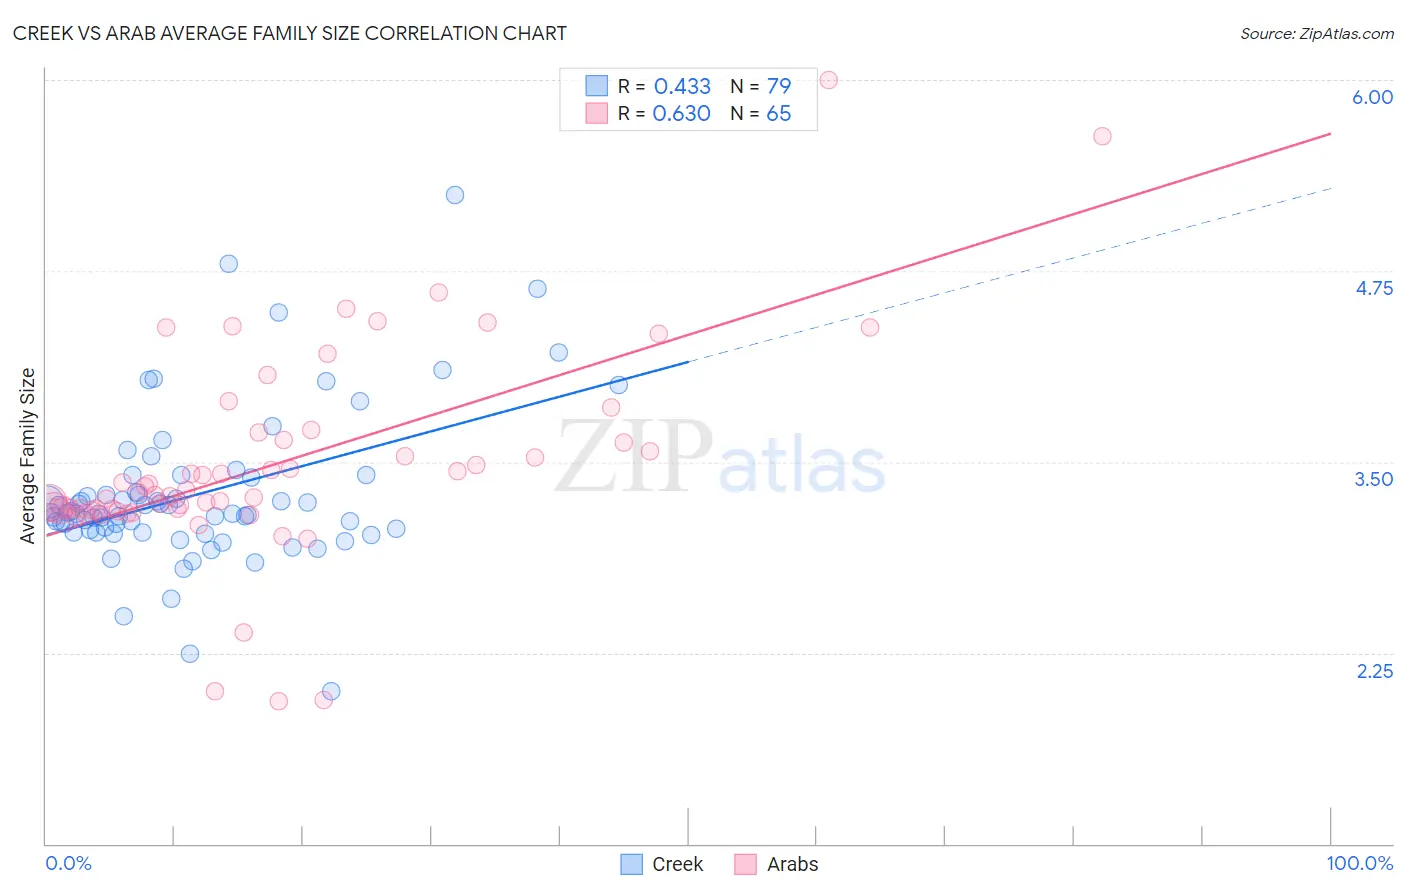
Creek vs Arab Average Family Size Correlation Chart
The statistical analysis conducted on geographies consisting of 178,433,281 people shows a moderate positive correlation between the proportion of Creek and average family size in the United States with a correlation coefficient (R) of 0.433 and weighted average of 3.20. Similarly, the statistical analysis conducted on geographies consisting of 486,389,490 people shows a significant positive correlation between the proportion of Arabs and average family size in the United States with a correlation coefficient (R) of 0.630 and weighted average of 3.23, a difference of 0.98%.
Average Family Size Correlation Summary
| Measurement | Creek | Arab |
| Minimum | 2.00 | 1.93 |
| Maximum | 5.25 | 6.00 |
| Range | 3.25 | 4.07 |
| Mean | 3.29 | 3.49 |
| Median | 3.16 | 3.30 |
| Interquartile 25% (IQ1) | 3.04 | 3.19 |
| Interquartile 75% (IQ3) | 3.40 | 3.67 |
| Interquartile Range (IQR) | 0.36 | 0.48 |
| Standard Deviation (Sample) | 0.51 | 0.69 |
| Standard Deviation (Population) | 0.51 | 0.68 |
Similar Demographics by Average Family Size
Demographics Similar to Creek by Average Family Size
In terms of average family size, the demographic groups most similar to Creek are Immigrants from Iran (3.20, a difference of 0.0%), Zimbabwean (3.20, a difference of 0.020%), Mongolian (3.20, a difference of 0.020%), Somali (3.20, a difference of 0.040%), and Chippewa (3.20, a difference of 0.050%).
| Demographics | Rating | Rank | Average Family Size |
| Paraguayans | 16.3 /100 | #205 | Poor 3.20 |
| Immigrants | Cabo Verde | 16.0 /100 | #206 | Poor 3.20 |
| Filipinos | 13.6 /100 | #207 | Poor 3.20 |
| Chippewa | 13.3 /100 | #208 | Poor 3.20 |
| Sudanese | 13.3 /100 | #209 | Poor 3.20 |
| Zimbabweans | 12.6 /100 | #210 | Poor 3.20 |
| Immigrants | Iran | 12.1 /100 | #211 | Poor 3.20 |
| Creek | 12.1 /100 | #212 | Poor 3.20 |
| Mongolians | 11.5 /100 | #213 | Poor 3.20 |
| Somalis | 11.2 /100 | #214 | Poor 3.20 |
| Delaware | 11.1 /100 | #215 | Poor 3.20 |
| Bermudans | 11.0 /100 | #216 | Poor 3.20 |
| Immigrants | Somalia | 10.3 /100 | #217 | Poor 3.20 |
| French American Indians | 9.8 /100 | #218 | Tragic 3.20 |
| Pennsylvania Germans | 9.3 /100 | #219 | Tragic 3.19 |
Demographics Similar to Arabs by Average Family Size
In terms of average family size, the demographic groups most similar to Arabs are Taiwanese (3.23, a difference of 0.010%), Aleut (3.23, a difference of 0.010%), Chilean (3.23, a difference of 0.010%), Immigrants from Congo (3.23, a difference of 0.020%), and Immigrants from Uruguay (3.23, a difference of 0.030%).
| Demographics | Rating | Rank | Average Family Size |
| Uruguayans | 58.8 /100 | #163 | Average 3.23 |
| Egyptians | 58.6 /100 | #164 | Average 3.23 |
| Ugandans | 58.4 /100 | #165 | Average 3.23 |
| Immigrants | Senegal | 57.5 /100 | #166 | Average 3.23 |
| Dutch West Indians | 56.9 /100 | #167 | Average 3.23 |
| Taiwanese | 54.2 /100 | #168 | Average 3.23 |
| Aleuts | 54.1 /100 | #169 | Average 3.23 |
| Arabs | 53.8 /100 | #170 | Average 3.23 |
| Chileans | 53.2 /100 | #171 | Average 3.23 |
| Immigrants | Congo | 52.7 /100 | #172 | Average 3.23 |
| Immigrants | Uruguay | 52.0 /100 | #173 | Average 3.23 |
| Immigrants | South Central Asia | 50.0 /100 | #174 | Average 3.23 |
| Immigrants | China | 49.9 /100 | #175 | Average 3.23 |
| Israelis | 48.7 /100 | #176 | Average 3.23 |
| Argentineans | 47.4 /100 | #177 | Average 3.23 |