Immigrants from Chile vs Immigrants from Ukraine Currently Married
COMPARE
Immigrants from Chile
Immigrants from Ukraine
Currently Married
Currently Married Comparison
Immigrants from Chile
Immigrants from Ukraine
46.4%
CURRENTLY MARRIED
36.8/ 100
METRIC RATING
186th/ 347
METRIC RANK
47.9%
CURRENTLY MARRIED
94.8/ 100
METRIC RATING
97th/ 347
METRIC RANK
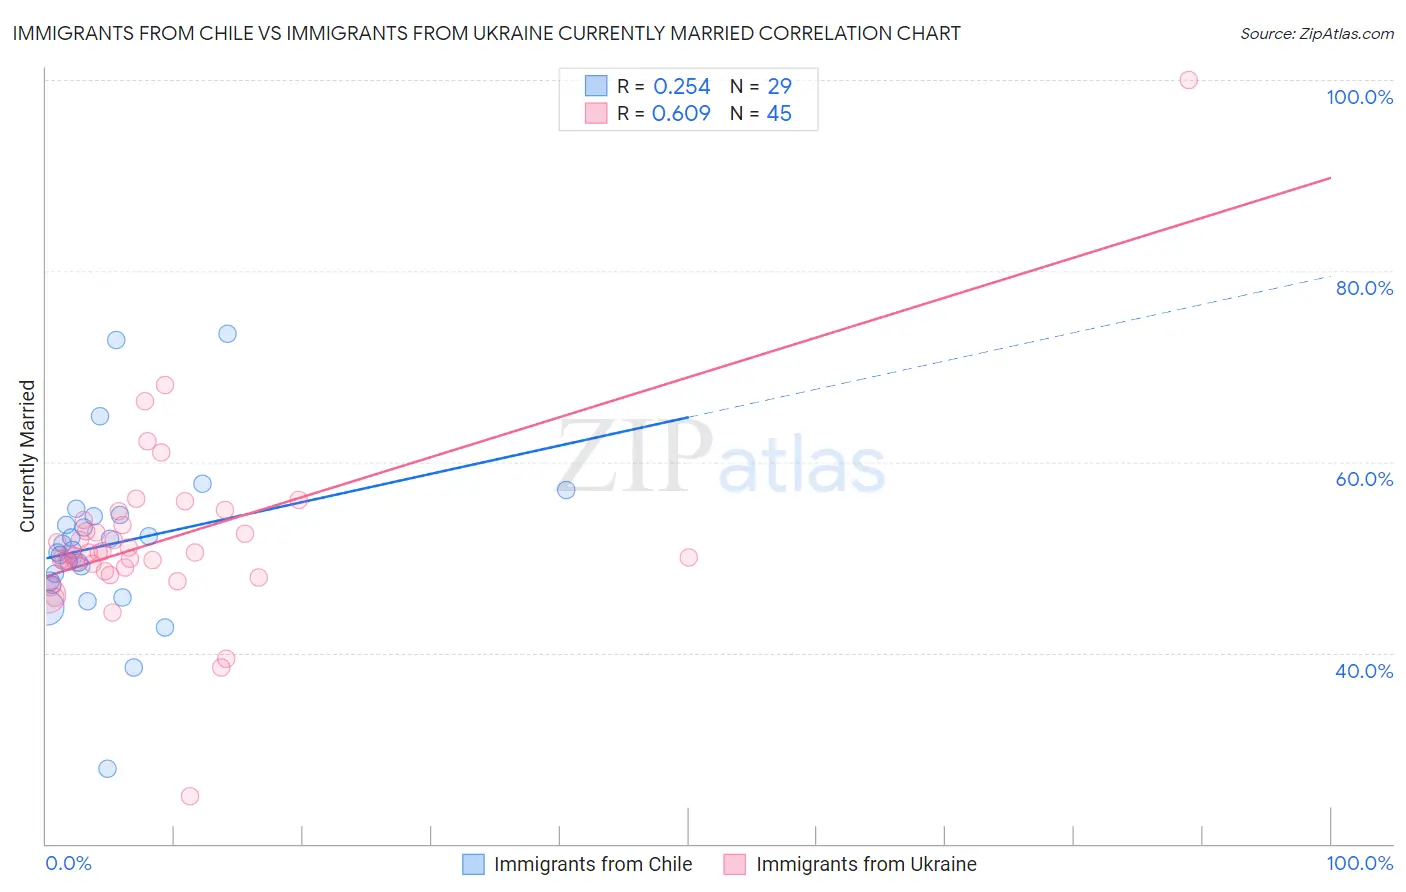
Immigrants from Chile vs Immigrants from Ukraine Currently Married Correlation Chart
The statistical analysis conducted on geographies consisting of 218,644,057 people shows a weak positive correlation between the proportion of Immigrants from Chile and percentage of population currently married in the United States with a correlation coefficient (R) of 0.254 and weighted average of 46.4%. Similarly, the statistical analysis conducted on geographies consisting of 289,694,818 people shows a significant positive correlation between the proportion of Immigrants from Ukraine and percentage of population currently married in the United States with a correlation coefficient (R) of 0.609 and weighted average of 47.9%, a difference of 3.2%.
Currently Married Correlation Summary
| Measurement | Immigrants from Chile | Immigrants from Ukraine |
| Minimum | 27.8% | 25.0% |
| Maximum | 73.4% | 100.0% |
| Range | 45.6% | 75.0% |
| Mean | 51.4% | 51.9% |
| Median | 50.8% | 50.5% |
| Interquartile 25% (IQ1) | 47.3% | 48.7% |
| Interquartile 75% (IQ3) | 54.4% | 53.6% |
| Interquartile Range (IQR) | 7.0% | 4.9% |
| Standard Deviation (Sample) | 8.9% | 10.0% |
| Standard Deviation (Population) | 8.7% | 9.9% |
Similar Demographics by Currently Married
Demographics Similar to Immigrants from Chile by Currently Married
In terms of currently married, the demographic groups most similar to Immigrants from Chile are Mongolian (46.4%, a difference of 0.030%), Immigrants from Peru (46.4%, a difference of 0.060%), Brazilian (46.4%, a difference of 0.10%), Immigrants from Northern Africa (46.5%, a difference of 0.11%), and Potawatomi (46.5%, a difference of 0.20%).
| Demographics | Rating | Rank | Currently Married |
| Immigrants | Oceania | 44.6 /100 | #179 | Average 46.5% |
| Costa Ricans | 43.7 /100 | #180 | Average 46.5% |
| Ottawa | 43.0 /100 | #181 | Average 46.5% |
| Potawatomi | 41.9 /100 | #182 | Average 46.5% |
| Immigrants | Northern Africa | 39.7 /100 | #183 | Fair 46.5% |
| Brazilians | 39.3 /100 | #184 | Fair 46.4% |
| Mongolians | 37.6 /100 | #185 | Fair 46.4% |
| Immigrants | Chile | 36.8 /100 | #186 | Fair 46.4% |
| Immigrants | Peru | 35.3 /100 | #187 | Fair 46.4% |
| Colombians | 31.8 /100 | #188 | Fair 46.3% |
| Fijians | 30.3 /100 | #189 | Fair 46.3% |
| Choctaw | 29.1 /100 | #190 | Fair 46.3% |
| Immigrants | France | 27.7 /100 | #191 | Fair 46.2% |
| Soviet Union | 25.7 /100 | #192 | Fair 46.2% |
| Immigrants | Fiji | 25.0 /100 | #193 | Fair 46.2% |
Demographics Similar to Immigrants from Ukraine by Currently Married
In terms of currently married, the demographic groups most similar to Immigrants from Ukraine are Immigrants from Bulgaria (47.9%, a difference of 0.010%), Egyptian (47.9%, a difference of 0.010%), Immigrants from China (47.9%, a difference of 0.020%), Native Hawaiian (47.9%, a difference of 0.040%), and Lebanese (47.9%, a difference of 0.060%).
| Demographics | Rating | Rank | Currently Married |
| Americans | 95.7 /100 | #90 | Exceptional 48.0% |
| Immigrants | Bolivia | 95.6 /100 | #91 | Exceptional 47.9% |
| Koreans | 95.4 /100 | #92 | Exceptional 47.9% |
| Lebanese | 95.1 /100 | #93 | Exceptional 47.9% |
| Native Hawaiians | 95.0 /100 | #94 | Exceptional 47.9% |
| Immigrants | Bulgaria | 94.8 /100 | #95 | Exceptional 47.9% |
| Egyptians | 94.8 /100 | #96 | Exceptional 47.9% |
| Immigrants | Ukraine | 94.8 /100 | #97 | Exceptional 47.9% |
| Immigrants | China | 94.7 /100 | #98 | Exceptional 47.9% |
| Immigrants | Sweden | 94.3 /100 | #99 | Exceptional 47.8% |
| Celtics | 94.2 /100 | #100 | Exceptional 47.8% |
| Immigrants | Germany | 94.1 /100 | #101 | Exceptional 47.8% |
| Turks | 93.9 /100 | #102 | Exceptional 47.8% |
| Cypriots | 93.7 /100 | #103 | Exceptional 47.8% |
| Serbians | 93.6 /100 | #104 | Exceptional 47.8% |