Bulgarian vs South African Births to Unmarried Women
COMPARE
Bulgarian
South African
Births to Unmarried Women
Births to Unmarried Women Comparison
Bulgarians
South Africans
27.1%
BIRTHS TO UNMARRIED WOMEN
99.8/ 100
METRIC RATING
30th/ 347
METRIC RANK
30.5%
BIRTHS TO UNMARRIED WOMEN
82.7/ 100
METRIC RATING
142nd/ 347
METRIC RANK
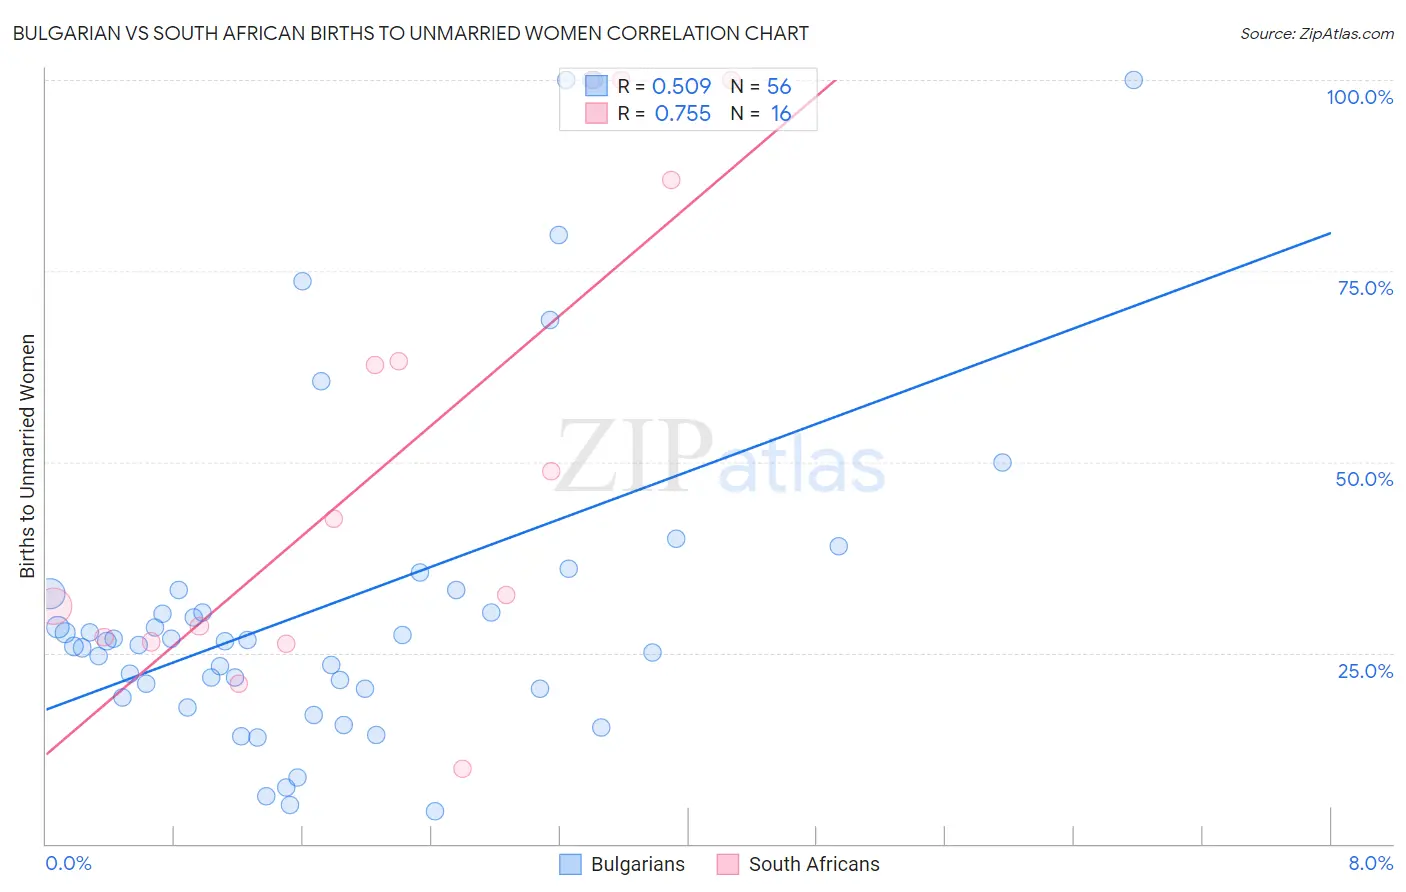
Bulgarian vs South African Births to Unmarried Women Correlation Chart
The statistical analysis conducted on geographies consisting of 195,514,672 people shows a substantial positive correlation between the proportion of Bulgarians and percentage of births to unmarried women in the United States with a correlation coefficient (R) of 0.509 and weighted average of 27.1%. Similarly, the statistical analysis conducted on geographies consisting of 173,176,697 people shows a strong positive correlation between the proportion of South Africans and percentage of births to unmarried women in the United States with a correlation coefficient (R) of 0.755 and weighted average of 30.5%, a difference of 12.7%.
Births to Unmarried Women Correlation Summary
| Measurement | Bulgarian | South African |
| Minimum | 4.2% | 9.7% |
| Maximum | 100.0% | 100.0% |
| Range | 95.8% | 90.3% |
| Mean | 31.4% | 50.4% |
| Median | 26.5% | 37.5% |
| Interquartile 25% (IQ1) | 20.3% | 26.7% |
| Interquartile 75% (IQ3) | 33.0% | 75.0% |
| Interquartile Range (IQR) | 12.7% | 48.3% |
| Standard Deviation (Sample) | 22.3% | 31.1% |
| Standard Deviation (Population) | 22.1% | 30.1% |
Similar Demographics by Births to Unmarried Women
Demographics Similar to Bulgarians by Births to Unmarried Women
In terms of births to unmarried women, the demographic groups most similar to Bulgarians are Cypriot (27.0%, a difference of 0.16%), Immigrants from Iraq (27.1%, a difference of 0.29%), Immigrants from Russia (27.1%, a difference of 0.32%), Immigrants from Sri Lanka (27.2%, a difference of 0.39%), and Immigrants from Pakistan (27.2%, a difference of 0.43%).
| Demographics | Rating | Rank | Births to Unmarried Women |
| Immigrants | Japan | 99.9 /100 | #23 | Exceptional 26.4% |
| Immigrants | Australia | 99.9 /100 | #24 | Exceptional 26.6% |
| Cambodians | 99.9 /100 | #25 | Exceptional 26.7% |
| Asians | 99.9 /100 | #26 | Exceptional 26.8% |
| Immigrants | Asia | 99.9 /100 | #27 | Exceptional 26.8% |
| Okinawans | 99.8 /100 | #28 | Exceptional 26.9% |
| Cypriots | 99.8 /100 | #29 | Exceptional 27.0% |
| Bulgarians | 99.8 /100 | #30 | Exceptional 27.1% |
| Immigrants | Iraq | 99.8 /100 | #31 | Exceptional 27.1% |
| Immigrants | Russia | 99.8 /100 | #32 | Exceptional 27.1% |
| Immigrants | Sri Lanka | 99.8 /100 | #33 | Exceptional 27.2% |
| Immigrants | Pakistan | 99.8 /100 | #34 | Exceptional 27.2% |
| Immigrants | Ireland | 99.7 /100 | #35 | Exceptional 27.2% |
| Immigrants | Western Asia | 99.7 /100 | #36 | Exceptional 27.2% |
| Immigrants | Ukraine | 99.7 /100 | #37 | Exceptional 27.2% |
Demographics Similar to South Africans by Births to Unmarried Women
In terms of births to unmarried women, the demographic groups most similar to South Africans are Immigrants from Uganda (30.5%, a difference of 0.020%), Pakistani (30.5%, a difference of 0.060%), Swiss (30.5%, a difference of 0.080%), Czech (30.5%, a difference of 0.090%), and Immigrants from Canada (30.4%, a difference of 0.19%).
| Demographics | Rating | Rank | Births to Unmarried Women |
| Brazilians | 84.8 /100 | #135 | Excellent 30.4% |
| Immigrants | Scotland | 84.6 /100 | #136 | Excellent 30.4% |
| Immigrants | Philippines | 83.9 /100 | #137 | Excellent 30.4% |
| Puget Sound Salish | 83.9 /100 | #138 | Excellent 30.4% |
| Immigrants | Canada | 83.7 /100 | #139 | Excellent 30.4% |
| Swiss | 83.1 /100 | #140 | Excellent 30.5% |
| Pakistanis | 83.0 /100 | #141 | Excellent 30.5% |
| South Africans | 82.7 /100 | #142 | Excellent 30.5% |
| Immigrants | Uganda | 82.6 /100 | #143 | Excellent 30.5% |
| Czechs | 82.1 /100 | #144 | Excellent 30.5% |
| Immigrants | North America | 81.5 /100 | #145 | Excellent 30.6% |
| Northern Europeans | 81.4 /100 | #146 | Excellent 30.6% |
| Immigrants | Oceania | 81.2 /100 | #147 | Excellent 30.6% |
| Chileans | 79.1 /100 | #148 | Good 30.7% |
| Serbians | 78.8 /100 | #149 | Good 30.7% |