Zimbabwean vs Immigrants from Colombia Single Father Households
COMPARE
Zimbabwean
Immigrants from Colombia
Single Father Households
Single Father Households Comparison
Zimbabweans
Immigrants from Colombia
2.2%
SINGLE FATHER HOUSEHOLDS
95.1/ 100
METRIC RATING
134th/ 347
METRIC RANK
2.4%
SINGLE FATHER HOUSEHOLDS
34.0/ 100
METRIC RATING
187th/ 347
METRIC RANK
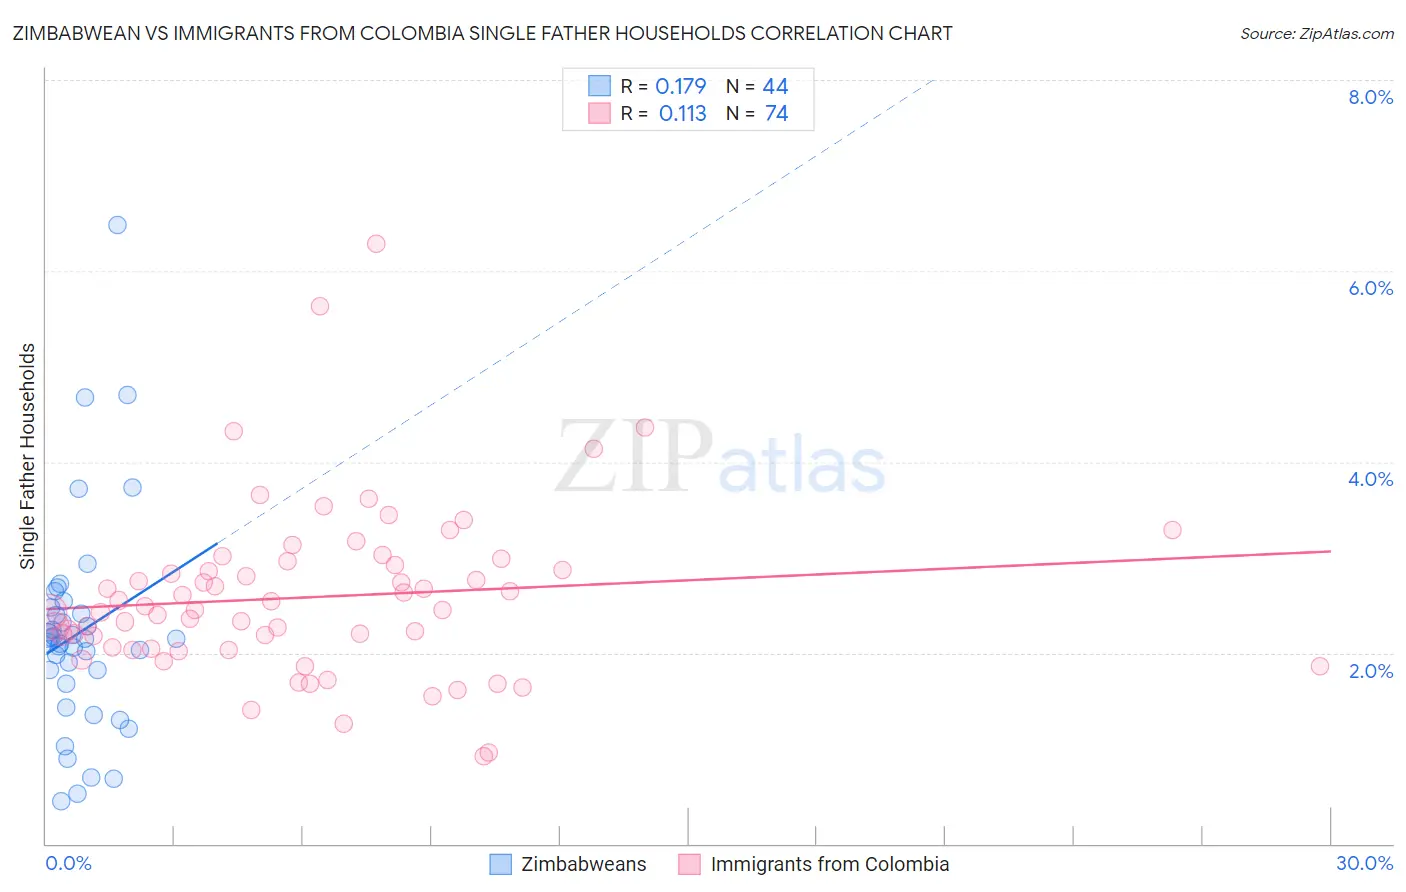
Zimbabwean vs Immigrants from Colombia Single Father Households Correlation Chart
The statistical analysis conducted on geographies consisting of 69,107,979 people shows a poor positive correlation between the proportion of Zimbabweans and percentage of single father households in the United States with a correlation coefficient (R) of 0.179 and weighted average of 2.2%. Similarly, the statistical analysis conducted on geographies consisting of 375,877,242 people shows a poor positive correlation between the proportion of Immigrants from Colombia and percentage of single father households in the United States with a correlation coefficient (R) of 0.113 and weighted average of 2.4%, a difference of 7.0%.
Single Father Households Correlation Summary
| Measurement | Zimbabwean | Immigrants from Colombia |
| Minimum | 0.45% | 0.91% |
| Maximum | 6.5% | 6.3% |
| Range | 6.0% | 5.4% |
| Mean | 2.2% | 2.6% |
| Median | 2.1% | 2.4% |
| Interquartile 25% (IQ1) | 1.7% | 2.0% |
| Interquartile 75% (IQ3) | 2.4% | 2.9% |
| Interquartile Range (IQR) | 0.70% | 0.88% |
| Standard Deviation (Sample) | 1.1% | 0.90% |
| Standard Deviation (Population) | 1.1% | 0.89% |
Similar Demographics by Single Father Households
Demographics Similar to Zimbabweans by Single Father Households
In terms of single father households, the demographic groups most similar to Zimbabweans are Syrian (2.2%, a difference of 0.11%), Chilean (2.2%, a difference of 0.23%), Austrian (2.2%, a difference of 0.34%), West Indian (2.2%, a difference of 0.37%), and Taiwanese (2.2%, a difference of 0.60%).
| Demographics | Rating | Rank | Single Father Households |
| Jordanians | 96.9 /100 | #127 | Exceptional 2.2% |
| Immigrants | England | 96.8 /100 | #128 | Exceptional 2.2% |
| Serbians | 96.8 /100 | #129 | Exceptional 2.2% |
| Immigrants | Chile | 96.7 /100 | #130 | Exceptional 2.2% |
| Immigrants | Jordan | 96.6 /100 | #131 | Exceptional 2.2% |
| Poles | 96.5 /100 | #132 | Exceptional 2.2% |
| Taiwanese | 96.3 /100 | #133 | Exceptional 2.2% |
| Zimbabweans | 95.1 /100 | #134 | Exceptional 2.2% |
| Syrians | 94.8 /100 | #135 | Exceptional 2.2% |
| Chileans | 94.5 /100 | #136 | Exceptional 2.2% |
| Austrians | 94.2 /100 | #137 | Exceptional 2.2% |
| West Indians | 94.1 /100 | #138 | Exceptional 2.2% |
| Brazilians | 92.8 /100 | #139 | Exceptional 2.2% |
| British | 92.8 /100 | #140 | Exceptional 2.2% |
| Laotians | 92.5 /100 | #141 | Exceptional 2.2% |
Demographics Similar to Immigrants from Colombia by Single Father Households
In terms of single father households, the demographic groups most similar to Immigrants from Colombia are Hmong (2.4%, a difference of 0.080%), U.S. Virgin Islander (2.4%, a difference of 0.18%), French (2.4%, a difference of 0.19%), Immigrants from Africa (2.4%, a difference of 0.33%), and Immigrants from Sudan (2.4%, a difference of 0.35%).
| Demographics | Rating | Rank | Single Father Households |
| Yugoslavians | 43.9 /100 | #180 | Average 2.3% |
| Jamaicans | 43.5 /100 | #181 | Average 2.3% |
| Belgians | 43.3 /100 | #182 | Average 2.3% |
| Immigrants | Panama | 41.8 /100 | #183 | Average 2.4% |
| Sri Lankans | 41.8 /100 | #184 | Average 2.4% |
| Nigerians | 41.0 /100 | #185 | Average 2.4% |
| Immigrants | Bosnia and Herzegovina | 40.4 /100 | #186 | Average 2.4% |
| Immigrants | Colombia | 34.0 /100 | #187 | Fair 2.4% |
| Hmong | 33.0 /100 | #188 | Fair 2.4% |
| U.S. Virgin Islanders | 31.8 /100 | #189 | Fair 2.4% |
| French | 31.7 /100 | #190 | Fair 2.4% |
| Immigrants | Africa | 30.0 /100 | #191 | Fair 2.4% |
| Immigrants | Sudan | 29.8 /100 | #192 | Fair 2.4% |
| Uruguayans | 29.7 /100 | #193 | Fair 2.4% |
| Panamanians | 29.6 /100 | #194 | Fair 2.4% |