British West Indian vs Blackfeet Single Father Households
COMPARE
British West Indian
Blackfeet
Single Father Households
Single Father Households Comparison
British West Indians
Blackfeet
2.2%
SINGLE FATHER HOUSEHOLDS
97.4/ 100
METRIC RATING
124th/ 347
METRIC RANK
2.7%
SINGLE FATHER HOUSEHOLDS
0.0/ 100
METRIC RATING
291st/ 347
METRIC RANK
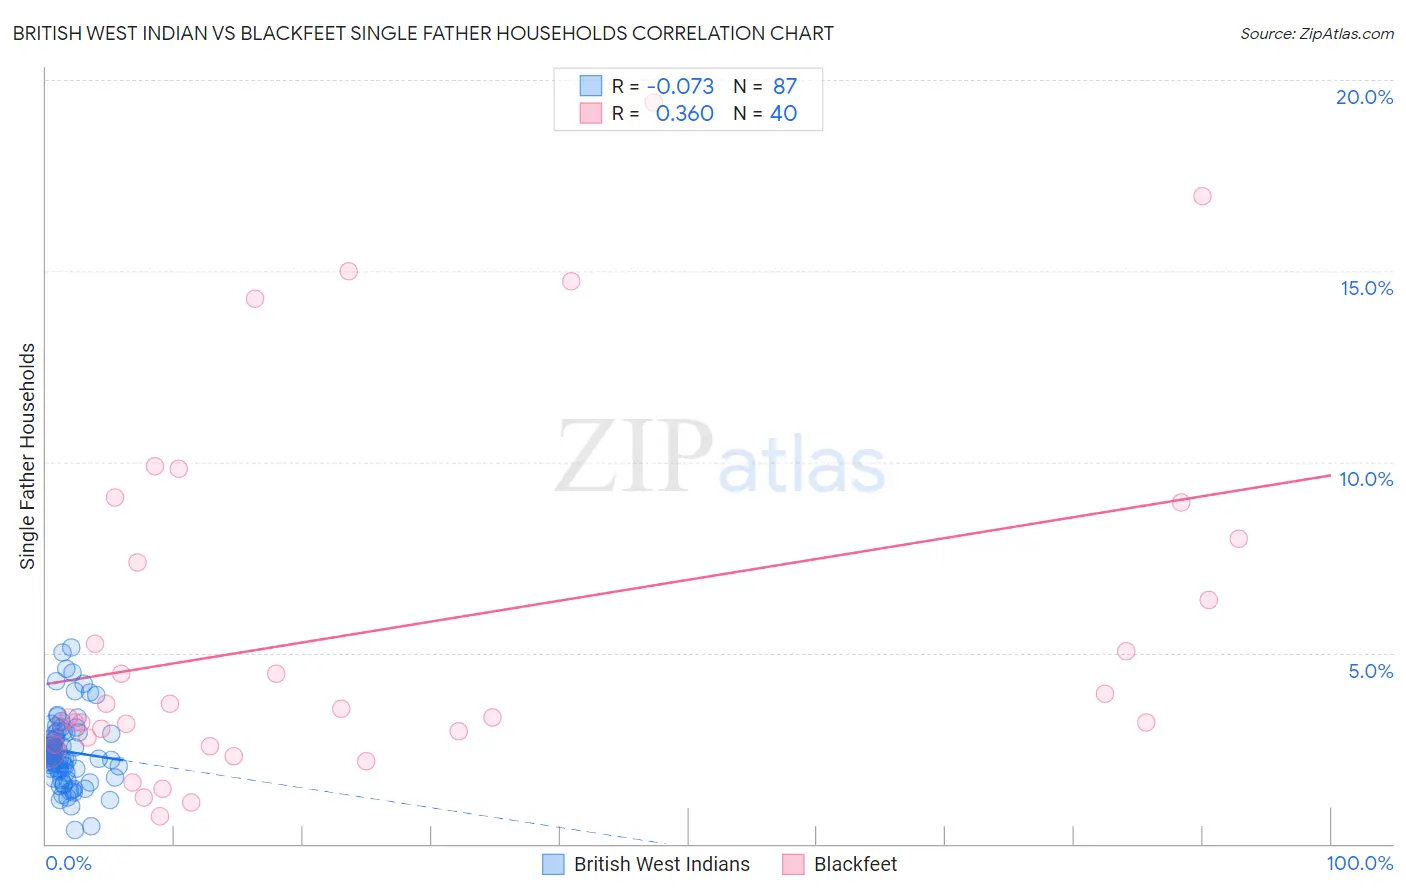
British West Indian vs Blackfeet Single Father Households Correlation Chart
The statistical analysis conducted on geographies consisting of 152,266,714 people shows a slight negative correlation between the proportion of British West Indians and percentage of single father households in the United States with a correlation coefficient (R) of -0.073 and weighted average of 2.2%. Similarly, the statistical analysis conducted on geographies consisting of 307,723,942 people shows a mild positive correlation between the proportion of Blackfeet and percentage of single father households in the United States with a correlation coefficient (R) of 0.360 and weighted average of 2.7%, a difference of 23.8%.
Single Father Households Correlation Summary
| Measurement | British West Indian | Blackfeet |
| Minimum | 0.35% | 0.71% |
| Maximum | 5.1% | 19.4% |
| Range | 4.8% | 18.7% |
| Mean | 2.4% | 5.6% |
| Median | 2.3% | 3.4% |
| Interquartile 25% (IQ1) | 1.9% | 2.7% |
| Interquartile 75% (IQ3) | 2.9% | 7.7% |
| Interquartile Range (IQR) | 0.98% | 5.0% |
| Standard Deviation (Sample) | 0.92% | 4.7% |
| Standard Deviation (Population) | 0.91% | 4.6% |
Similar Demographics by Single Father Households
Demographics Similar to British West Indians by Single Father Households
In terms of single father households, the demographic groups most similar to British West Indians are Immigrants from Yemen (2.2%, a difference of 0.020%), Immigrants from Indonesia (2.2%, a difference of 0.050%), Immigrants from Iraq (2.2%, a difference of 0.17%), Australian (2.2%, a difference of 0.27%), and Immigrants from Brazil (2.2%, a difference of 0.27%).
| Demographics | Rating | Rank | Single Father Households |
| Hungarians | 97.9 /100 | #117 | Exceptional 2.2% |
| Immigrants | Morocco | 97.8 /100 | #118 | Exceptional 2.2% |
| Trinidadians and Tobagonians | 97.8 /100 | #119 | Exceptional 2.2% |
| Australians | 97.7 /100 | #120 | Exceptional 2.2% |
| Immigrants | Brazil | 97.7 /100 | #121 | Exceptional 2.2% |
| Immigrants | Iraq | 97.6 /100 | #122 | Exceptional 2.2% |
| Immigrants | Yemen | 97.5 /100 | #123 | Exceptional 2.2% |
| British West Indians | 97.4 /100 | #124 | Exceptional 2.2% |
| Immigrants | Indonesia | 97.4 /100 | #125 | Exceptional 2.2% |
| Moroccans | 96.9 /100 | #126 | Exceptional 2.2% |
| Jordanians | 96.9 /100 | #127 | Exceptional 2.2% |
| Immigrants | England | 96.8 /100 | #128 | Exceptional 2.2% |
| Serbians | 96.8 /100 | #129 | Exceptional 2.2% |
| Immigrants | Chile | 96.7 /100 | #130 | Exceptional 2.2% |
| Immigrants | Jordan | 96.6 /100 | #131 | Exceptional 2.2% |
Demographics Similar to Blackfeet by Single Father Households
In terms of single father households, the demographic groups most similar to Blackfeet are Choctaw (2.7%, a difference of 0.46%), Puget Sound Salish (2.7%, a difference of 0.56%), Immigrants from Fiji (2.7%, a difference of 0.62%), Tlingit-Haida (2.7%, a difference of 1.0%), and Malaysian (2.7%, a difference of 1.1%).
| Demographics | Rating | Rank | Single Father Households |
| Hawaiians | 0.1 /100 | #284 | Tragic 2.7% |
| Ottawa | 0.1 /100 | #285 | Tragic 2.7% |
| Immigrants | Cuba | 0.1 /100 | #286 | Tragic 2.7% |
| Central American Indians | 0.0 /100 | #287 | Tragic 2.7% |
| Immigrants | Cambodia | 0.0 /100 | #288 | Tragic 2.7% |
| Tlingit-Haida | 0.0 /100 | #289 | Tragic 2.7% |
| Puget Sound Salish | 0.0 /100 | #290 | Tragic 2.7% |
| Blackfeet | 0.0 /100 | #291 | Tragic 2.7% |
| Choctaw | 0.0 /100 | #292 | Tragic 2.7% |
| Immigrants | Fiji | 0.0 /100 | #293 | Tragic 2.7% |
| Malaysians | 0.0 /100 | #294 | Tragic 2.7% |
| Chickasaw | 0.0 /100 | #295 | Tragic 2.8% |
| Japanese | 0.0 /100 | #296 | Tragic 2.8% |
| Hondurans | 0.0 /100 | #297 | Tragic 2.8% |
| Cree | 0.0 /100 | #298 | Tragic 2.8% |