British West Indian vs Immigrants from Norway Single Mother Households
COMPARE
British West Indian
Immigrants from Norway
Single Mother Households
Single Mother Households Comparison
British West Indians
Immigrants from Norway
8.4%
SINGLE MOTHER HOUSEHOLDS
0.0/ 100
METRIC RATING
326th/ 347
METRIC RANK
5.6%
SINGLE MOTHER HOUSEHOLDS
98.7/ 100
METRIC RATING
60th/ 347
METRIC RANK
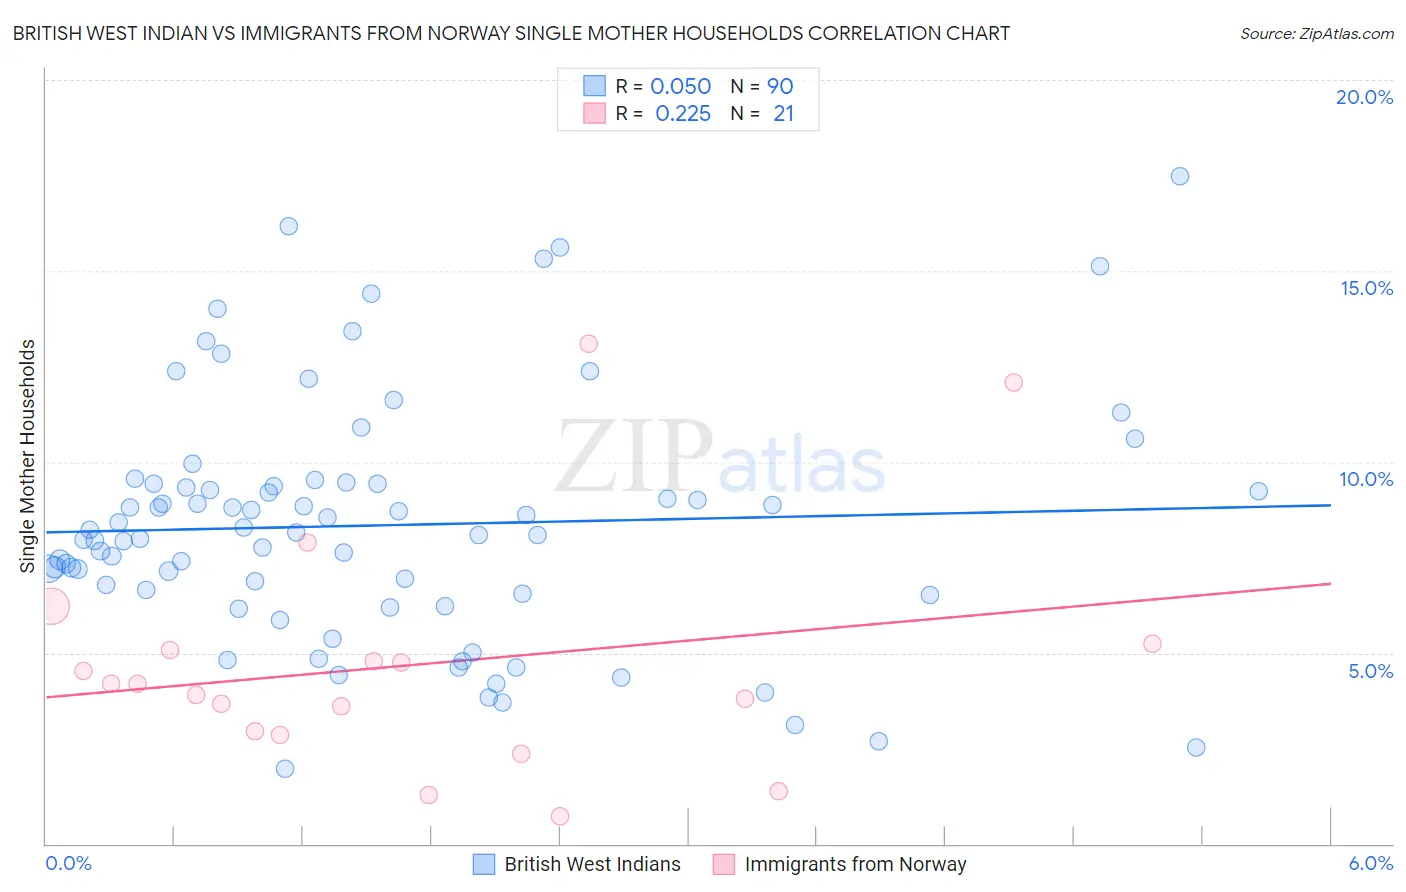
British West Indian vs Immigrants from Norway Single Mother Households Correlation Chart
The statistical analysis conducted on geographies consisting of 152,574,422 people shows no correlation between the proportion of British West Indians and percentage of single mother households in the United States with a correlation coefficient (R) of 0.050 and weighted average of 8.4%. Similarly, the statistical analysis conducted on geographies consisting of 116,559,086 people shows a weak positive correlation between the proportion of Immigrants from Norway and percentage of single mother households in the United States with a correlation coefficient (R) of 0.225 and weighted average of 5.6%, a difference of 50.6%.
Single Mother Households Correlation Summary
| Measurement | British West Indian | Immigrants from Norway |
| Minimum | 2.0% | 0.71% |
| Maximum | 17.5% | 13.1% |
| Range | 15.5% | 12.4% |
| Mean | 8.3% | 4.7% |
| Median | 8.1% | 4.2% |
| Interquartile 25% (IQ1) | 6.5% | 2.9% |
| Interquartile 75% (IQ3) | 9.4% | 5.2% |
| Interquartile Range (IQR) | 2.9% | 2.3% |
| Standard Deviation (Sample) | 3.2% | 3.1% |
| Standard Deviation (Population) | 3.2% | 3.0% |
Similar Demographics by Single Mother Households
Demographics Similar to British West Indians by Single Mother Households
In terms of single mother households, the demographic groups most similar to British West Indians are Immigrants from Caribbean (8.4%, a difference of 0.12%), Immigrants from Haiti (8.4%, a difference of 0.15%), Immigrants from Jamaica (8.4%, a difference of 0.31%), Yakama (8.4%, a difference of 0.32%), and Haitian (8.3%, a difference of 0.74%).
| Demographics | Rating | Rank | Single Mother Households |
| Jamaicans | 0.0 /100 | #319 | Tragic 8.2% |
| Bahamians | 0.0 /100 | #320 | Tragic 8.3% |
| Immigrants | Senegal | 0.0 /100 | #321 | Tragic 8.3% |
| Pima | 0.0 /100 | #322 | Tragic 8.3% |
| Haitians | 0.0 /100 | #323 | Tragic 8.3% |
| Immigrants | Jamaica | 0.0 /100 | #324 | Tragic 8.4% |
| Immigrants | Caribbean | 0.0 /100 | #325 | Tragic 8.4% |
| British West Indians | 0.0 /100 | #326 | Tragic 8.4% |
| Immigrants | Haiti | 0.0 /100 | #327 | Tragic 8.4% |
| Yakama | 0.0 /100 | #328 | Tragic 8.4% |
| Hopi | 0.0 /100 | #329 | Tragic 8.5% |
| Inupiat | 0.0 /100 | #330 | Tragic 8.5% |
| Sioux | 0.0 /100 | #331 | Tragic 8.5% |
| U.S. Virgin Islanders | 0.0 /100 | #332 | Tragic 8.6% |
| Liberians | 0.0 /100 | #333 | Tragic 8.6% |
Demographics Similar to Immigrants from Norway by Single Mother Households
In terms of single mother households, the demographic groups most similar to Immigrants from Norway are Australian (5.6%, a difference of 0.070%), Polish (5.6%, a difference of 0.080%), Luxembourger (5.6%, a difference of 0.15%), Immigrants from North Macedonia (5.6%, a difference of 0.15%), and Immigrants from France (5.6%, a difference of 0.18%).
| Demographics | Rating | Rank | Single Mother Households |
| Immigrants | Russia | 99.1 /100 | #53 | Exceptional 5.5% |
| Immigrants | Lebanon | 99.1 /100 | #54 | Exceptional 5.5% |
| Immigrants | Denmark | 99.1 /100 | #55 | Exceptional 5.5% |
| Immigrants | Romania | 99.0 /100 | #56 | Exceptional 5.5% |
| Immigrants | Europe | 99.0 /100 | #57 | Exceptional 5.5% |
| Danes | 98.9 /100 | #58 | Exceptional 5.5% |
| Luxembourgers | 98.7 /100 | #59 | Exceptional 5.6% |
| Immigrants | Norway | 98.7 /100 | #60 | Exceptional 5.6% |
| Australians | 98.7 /100 | #61 | Exceptional 5.6% |
| Poles | 98.6 /100 | #62 | Exceptional 5.6% |
| Immigrants | North Macedonia | 98.6 /100 | #63 | Exceptional 5.6% |
| Immigrants | France | 98.6 /100 | #64 | Exceptional 5.6% |
| Greeks | 98.6 /100 | #65 | Exceptional 5.6% |
| Immigrants | Canada | 98.5 /100 | #66 | Exceptional 5.6% |
| Italians | 98.5 /100 | #67 | Exceptional 5.6% |