Bolivian vs Barbadian Births to Unmarried Women
COMPARE
Bolivian
Barbadian
Births to Unmarried Women
Births to Unmarried Women Comparison
Bolivians
Barbadians
28.5%
BIRTHS TO UNMARRIED WOMEN
98.7/ 100
METRIC RATING
69th/ 347
METRIC RANK
37.0%
BIRTHS TO UNMARRIED WOMEN
0.1/ 100
METRIC RATING
275th/ 347
METRIC RANK
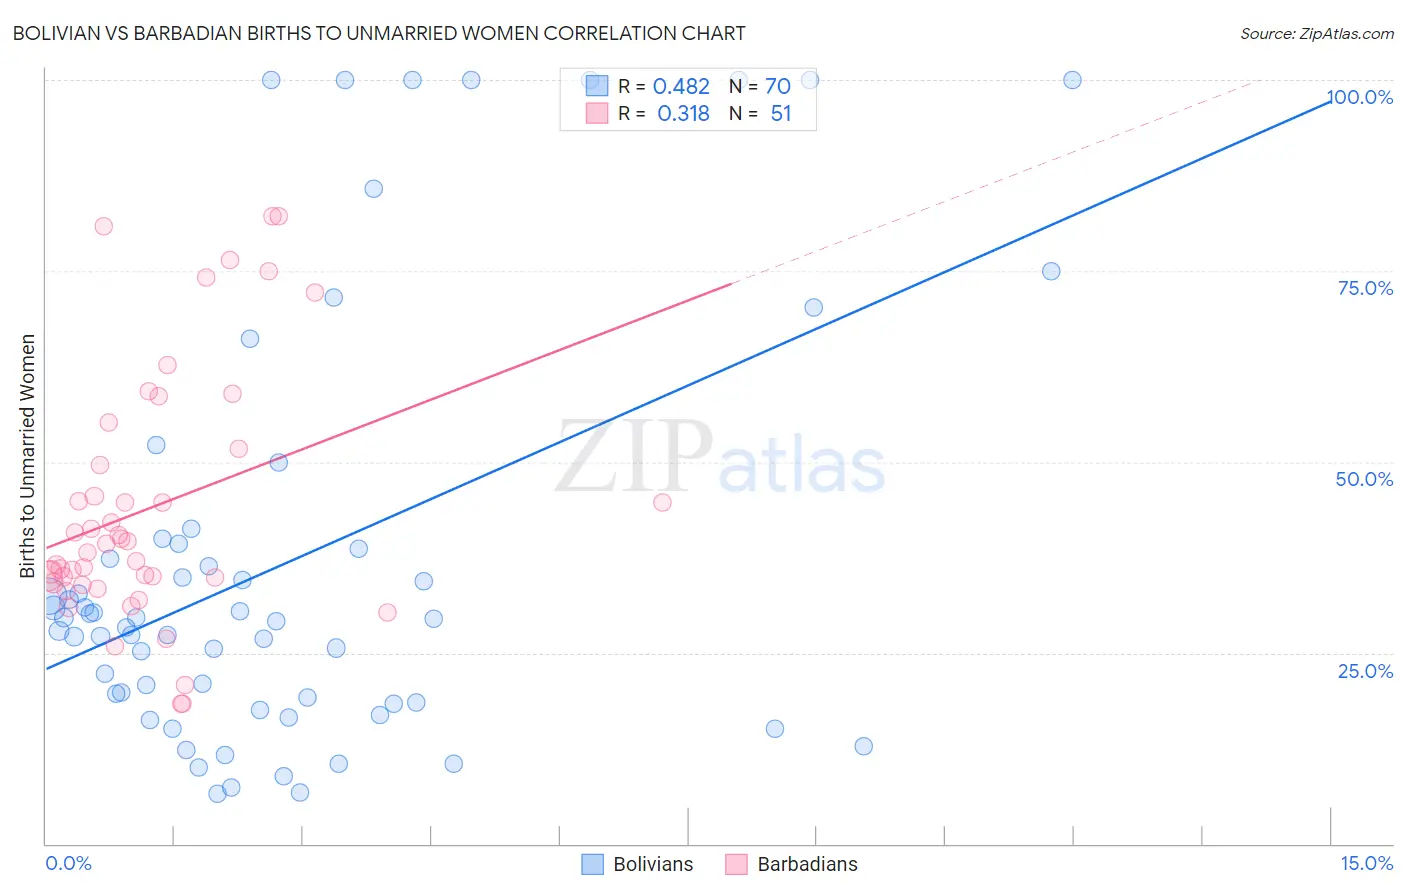
Bolivian vs Barbadian Births to Unmarried Women Correlation Chart
The statistical analysis conducted on geographies consisting of 177,966,984 people shows a moderate positive correlation between the proportion of Bolivians and percentage of births to unmarried women in the United States with a correlation coefficient (R) of 0.482 and weighted average of 28.5%. Similarly, the statistical analysis conducted on geographies consisting of 138,072,035 people shows a mild positive correlation between the proportion of Barbadians and percentage of births to unmarried women in the United States with a correlation coefficient (R) of 0.318 and weighted average of 37.0%, a difference of 29.9%.
Births to Unmarried Women Correlation Summary
| Measurement | Bolivian | Barbadian |
| Minimum | 6.5% | 18.3% |
| Maximum | 100.0% | 82.2% |
| Range | 93.5% | 63.9% |
| Mean | 37.1% | 44.0% |
| Median | 29.4% | 39.3% |
| Interquartile 25% (IQ1) | 18.5% | 34.1% |
| Interquartile 75% (IQ3) | 39.3% | 51.8% |
| Interquartile Range (IQR) | 20.8% | 17.7% |
| Standard Deviation (Sample) | 27.8% | 16.6% |
| Standard Deviation (Population) | 27.6% | 16.4% |
Similar Demographics by Births to Unmarried Women
Demographics Similar to Bolivians by Births to Unmarried Women
In terms of births to unmarried women, the demographic groups most similar to Bolivians are Immigrants from Europe (28.4%, a difference of 0.040%), Laotian (28.5%, a difference of 0.060%), Palestinian (28.4%, a difference of 0.090%), Immigrants from Egypt (28.4%, a difference of 0.20%), and Immigrants from Czechoslovakia (28.4%, a difference of 0.22%).
| Demographics | Rating | Rank | Births to Unmarried Women |
| Egyptians | 99.0 /100 | #62 | Exceptional 28.2% |
| Immigrants | Serbia | 98.9 /100 | #63 | Exceptional 28.3% |
| Tongans | 98.8 /100 | #64 | Exceptional 28.4% |
| Immigrants | Czechoslovakia | 98.8 /100 | #65 | Exceptional 28.4% |
| Immigrants | Egypt | 98.8 /100 | #66 | Exceptional 28.4% |
| Palestinians | 98.7 /100 | #67 | Exceptional 28.4% |
| Immigrants | Europe | 98.7 /100 | #68 | Exceptional 28.4% |
| Bolivians | 98.7 /100 | #69 | Exceptional 28.5% |
| Laotians | 98.6 /100 | #70 | Exceptional 28.5% |
| Jordanians | 98.5 /100 | #71 | Exceptional 28.5% |
| Immigrants | Sweden | 98.5 /100 | #72 | Exceptional 28.5% |
| Albanians | 98.5 /100 | #73 | Exceptional 28.5% |
| Immigrants | Bolivia | 98.5 /100 | #74 | Exceptional 28.6% |
| Immigrants | Switzerland | 98.4 /100 | #75 | Exceptional 28.6% |
| Israelis | 98.4 /100 | #76 | Exceptional 28.6% |
Demographics Similar to Barbadians by Births to Unmarried Women
In terms of births to unmarried women, the demographic groups most similar to Barbadians are Cree (37.0%, a difference of 0.030%), Mexican (36.9%, a difference of 0.12%), Belizean (37.0%, a difference of 0.19%), Choctaw (36.9%, a difference of 0.23%), and Guatemalan (37.1%, a difference of 0.41%).
| Demographics | Rating | Rank | Births to Unmarried Women |
| Comanche | 0.1 /100 | #268 | Tragic 36.7% |
| Senegalese | 0.1 /100 | #269 | Tragic 36.8% |
| Immigrants | Congo | 0.1 /100 | #270 | Tragic 36.8% |
| Immigrants | Barbados | 0.1 /100 | #271 | Tragic 36.8% |
| Choctaw | 0.1 /100 | #272 | Tragic 36.9% |
| Mexicans | 0.1 /100 | #273 | Tragic 36.9% |
| Cree | 0.1 /100 | #274 | Tragic 37.0% |
| Barbadians | 0.1 /100 | #275 | Tragic 37.0% |
| Belizeans | 0.1 /100 | #276 | Tragic 37.0% |
| Guatemalans | 0.1 /100 | #277 | Tragic 37.1% |
| Immigrants | Latin America | 0.1 /100 | #278 | Tragic 37.1% |
| West Indians | 0.1 /100 | #279 | Tragic 37.3% |
| Immigrants | St. Vincent and the Grenadines | 0.1 /100 | #280 | Tragic 37.3% |
| Immigrants | Belize | 0.1 /100 | #281 | Tragic 37.3% |
| Liberians | 0.0 /100 | #282 | Tragic 37.4% |