Bolivian vs Immigrants from India Child Poverty Under the Age of 16
COMPARE
Bolivian
Immigrants from India
Child Poverty Under the Age of 16
Child Poverty Under the Age of 16 Comparison
Bolivians
Immigrants from India
13.2%
CHILD POVERTY UNDER THE AGE OF 16
99.8/ 100
METRIC RATING
26th/ 347
METRIC RANK
10.8%
CHILD POVERTY UNDER THE AGE OF 16
100.0/ 100
METRIC RATING
1st/ 347
METRIC RANK
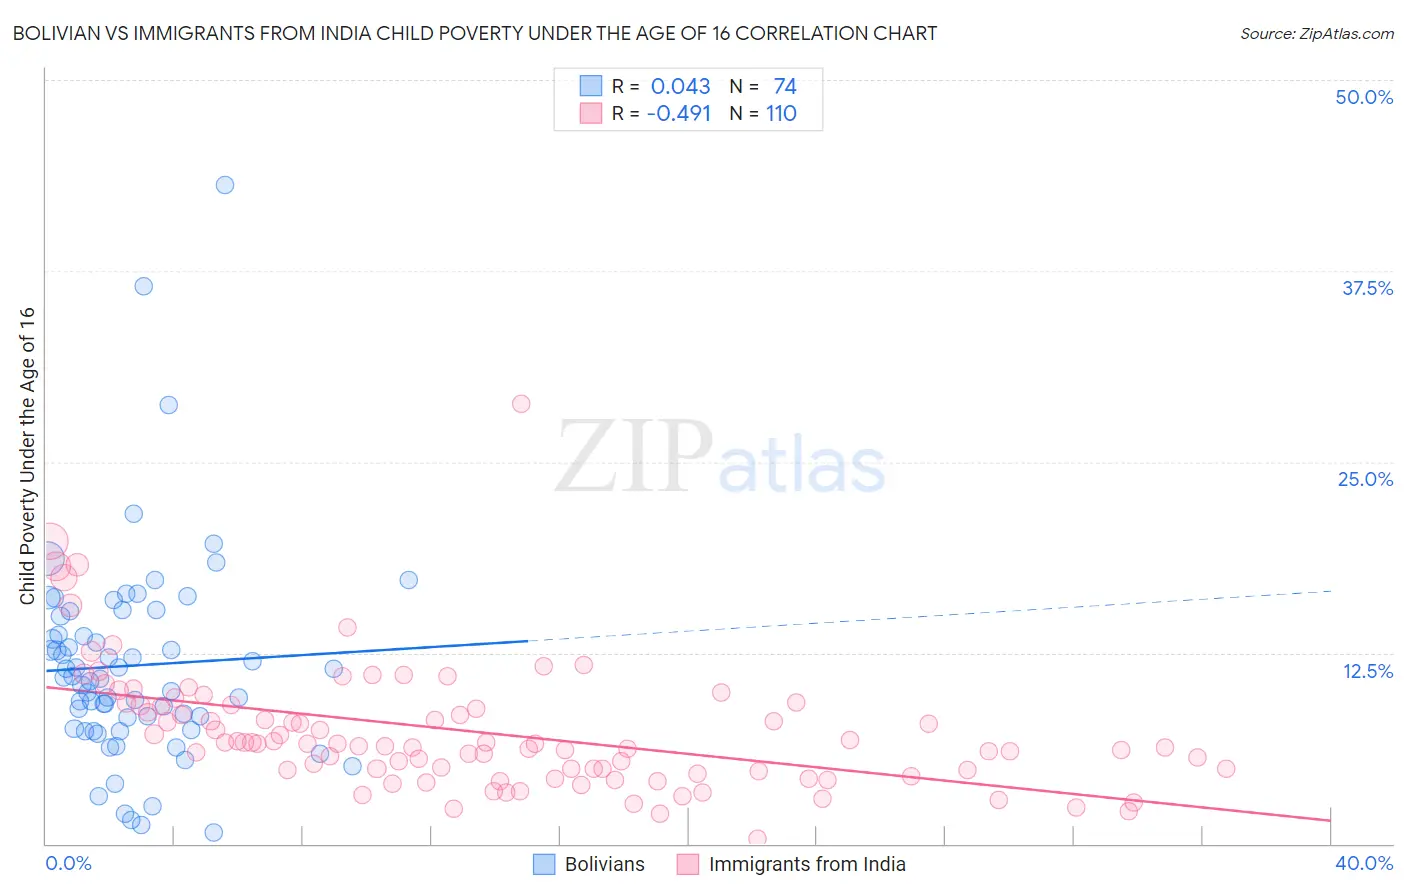
Bolivian vs Immigrants from India Child Poverty Under the Age of 16 Correlation Chart
The statistical analysis conducted on geographies consisting of 184,043,367 people shows no correlation between the proportion of Bolivians and poverty level among children under the age of 16 in the United States with a correlation coefficient (R) of 0.043 and weighted average of 13.2%. Similarly, the statistical analysis conducted on geographies consisting of 429,036,351 people shows a moderate negative correlation between the proportion of Immigrants from India and poverty level among children under the age of 16 in the United States with a correlation coefficient (R) of -0.491 and weighted average of 10.8%, a difference of 22.9%.
Child Poverty Under the Age of 16 Correlation Summary
| Measurement | Bolivian | Immigrants from India |
| Minimum | 0.74% | 0.35% |
| Maximum | 43.1% | 28.8% |
| Range | 42.4% | 28.4% |
| Mean | 11.7% | 7.3% |
| Median | 10.8% | 6.5% |
| Interquartile 25% (IQ1) | 7.6% | 4.8% |
| Interquartile 75% (IQ3) | 14.9% | 9.1% |
| Interquartile Range (IQR) | 7.3% | 4.2% |
| Standard Deviation (Sample) | 6.9% | 4.1% |
| Standard Deviation (Population) | 6.8% | 4.1% |
Similar Demographics by Child Poverty Under the Age of 16
Demographics Similar to Bolivians by Child Poverty Under the Age of 16
In terms of child poverty under the age of 16, the demographic groups most similar to Bolivians are Immigrants from China (13.3%, a difference of 0.29%), Eastern European (13.2%, a difference of 0.42%), Latvian (13.2%, a difference of 0.50%), Assyrian/Chaldean/Syriac (13.3%, a difference of 0.53%), and Indian (Asian) (13.1%, a difference of 0.71%).
| Demographics | Rating | Rank | Child Poverty Under the Age of 16 |
| Immigrants | Japan | 99.8 /100 | #19 | Exceptional 13.0% |
| Okinawans | 99.8 /100 | #20 | Exceptional 13.1% |
| Immigrants | Eastern Asia | 99.8 /100 | #21 | Exceptional 13.1% |
| Maltese | 99.8 /100 | #22 | Exceptional 13.1% |
| Indians (Asian) | 99.8 /100 | #23 | Exceptional 13.1% |
| Latvians | 99.8 /100 | #24 | Exceptional 13.2% |
| Eastern Europeans | 99.8 /100 | #25 | Exceptional 13.2% |
| Bolivians | 99.8 /100 | #26 | Exceptional 13.2% |
| Immigrants | China | 99.8 /100 | #27 | Exceptional 13.3% |
| Assyrians/Chaldeans/Syriacs | 99.7 /100 | #28 | Exceptional 13.3% |
| Swedes | 99.7 /100 | #29 | Exceptional 13.3% |
| Turks | 99.7 /100 | #30 | Exceptional 13.4% |
| Danes | 99.7 /100 | #31 | Exceptional 13.4% |
| Tongans | 99.7 /100 | #32 | Exceptional 13.4% |
| Asians | 99.6 /100 | #33 | Exceptional 13.5% |
Demographics Similar to Immigrants from India by Child Poverty Under the Age of 16
In terms of child poverty under the age of 16, the demographic groups most similar to Immigrants from India are Immigrants from Taiwan (11.0%, a difference of 2.5%), Filipino (11.1%, a difference of 3.4%), Thai (11.6%, a difference of 7.4%), Chinese (11.9%, a difference of 10.7%), and Immigrants from Hong Kong (12.1%, a difference of 12.7%).
| Demographics | Rating | Rank | Child Poverty Under the Age of 16 |
| Immigrants | India | 100.0 /100 | #1 | Exceptional 10.8% |
| Immigrants | Taiwan | 100.0 /100 | #2 | Exceptional 11.0% |
| Filipinos | 100.0 /100 | #3 | Exceptional 11.1% |
| Thais | 100.0 /100 | #4 | Exceptional 11.6% |
| Chinese | 100.0 /100 | #5 | Exceptional 11.9% |
| Immigrants | Hong Kong | 100.0 /100 | #6 | Exceptional 12.1% |
| Iranians | 100.0 /100 | #7 | Exceptional 12.2% |
| Immigrants | Singapore | 100.0 /100 | #8 | Exceptional 12.4% |
| Immigrants | Iran | 100.0 /100 | #9 | Exceptional 12.4% |
| Immigrants | South Central Asia | 99.9 /100 | #10 | Exceptional 12.5% |
| Bhutanese | 99.9 /100 | #11 | Exceptional 12.5% |
| Immigrants | Ireland | 99.9 /100 | #12 | Exceptional 12.7% |
| Burmese | 99.9 /100 | #13 | Exceptional 12.8% |
| Immigrants | Lithuania | 99.9 /100 | #14 | Exceptional 12.9% |
| Immigrants | Korea | 99.9 /100 | #15 | Exceptional 13.0% |