Blackfeet vs Immigrants from Scotland Divorced or Separated
COMPARE
Blackfeet
Immigrants from Scotland
Divorced or Separated
Divorced or Separated Comparison
Blackfeet
Immigrants from Scotland
13.3%
DIVORCED OR SEPARATED
0.0/ 100
METRIC RATING
312th/ 347
METRIC RANK
12.0%
DIVORCED OR SEPARATED
65.8/ 100
METRIC RATING
160th/ 347
METRIC RANK
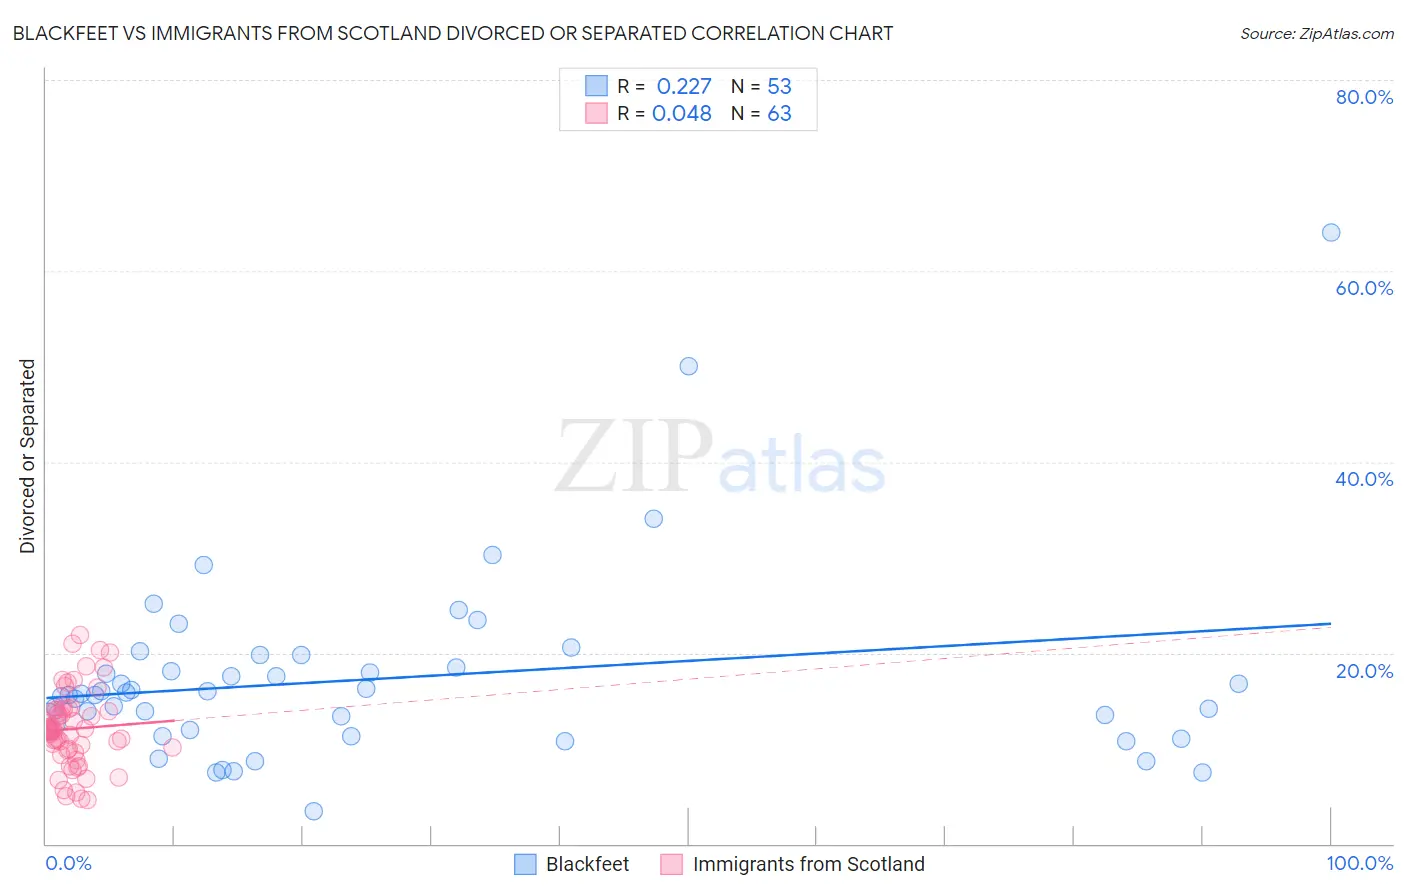
Blackfeet vs Immigrants from Scotland Divorced or Separated Correlation Chart
The statistical analysis conducted on geographies consisting of 309,547,647 people shows a weak positive correlation between the proportion of Blackfeet and percentage of population currently divorced or separated in the United States with a correlation coefficient (R) of 0.227 and weighted average of 13.3%. Similarly, the statistical analysis conducted on geographies consisting of 196,385,271 people shows no correlation between the proportion of Immigrants from Scotland and percentage of population currently divorced or separated in the United States with a correlation coefficient (R) of 0.048 and weighted average of 12.0%, a difference of 10.8%.
Divorced or Separated Correlation Summary
| Measurement | Blackfeet | Immigrants from Scotland |
| Minimum | 3.4% | 4.6% |
| Maximum | 64.0% | 21.8% |
| Range | 60.6% | 17.2% |
| Mean | 17.3% | 12.0% |
| Median | 15.7% | 11.9% |
| Interquartile 25% (IQ1) | 11.6% | 9.8% |
| Interquartile 75% (IQ3) | 19.1% | 14.1% |
| Interquartile Range (IQR) | 7.6% | 4.2% |
| Standard Deviation (Sample) | 10.0% | 4.0% |
| Standard Deviation (Population) | 9.9% | 4.0% |
Similar Demographics by Divorced or Separated
Demographics Similar to Blackfeet by Divorced or Separated
In terms of divorced or separated, the demographic groups most similar to Blackfeet are Immigrants from Nicaragua (13.3%, a difference of 0.19%), Yaqui (13.3%, a difference of 0.21%), Sioux (13.2%, a difference of 0.35%), African (13.2%, a difference of 0.37%), and American (13.2%, a difference of 0.39%).
| Demographics | Rating | Rank | Divorced or Separated |
| Chippewa | 0.0 /100 | #305 | Tragic 13.2% |
| Tlingit-Haida | 0.0 /100 | #306 | Tragic 13.2% |
| French American Indians | 0.0 /100 | #307 | Tragic 13.2% |
| Ottawa | 0.0 /100 | #308 | Tragic 13.2% |
| Americans | 0.0 /100 | #309 | Tragic 13.2% |
| Africans | 0.0 /100 | #310 | Tragic 13.2% |
| Sioux | 0.0 /100 | #311 | Tragic 13.2% |
| Blackfeet | 0.0 /100 | #312 | Tragic 13.3% |
| Immigrants | Nicaragua | 0.0 /100 | #313 | Tragic 13.3% |
| Yaqui | 0.0 /100 | #314 | Tragic 13.3% |
| Spanish Americans | 0.0 /100 | #315 | Tragic 13.3% |
| Tsimshian | 0.0 /100 | #316 | Tragic 13.3% |
| Haitians | 0.0 /100 | #317 | Tragic 13.3% |
| Cree | 0.0 /100 | #318 | Tragic 13.4% |
| Puget Sound Salish | 0.0 /100 | #319 | Tragic 13.4% |
Demographics Similar to Immigrants from Scotland by Divorced or Separated
In terms of divorced or separated, the demographic groups most similar to Immigrants from Scotland are Icelander (12.0%, a difference of 0.010%), Immigrants from Barbados (12.0%, a difference of 0.010%), Marshallese (12.0%, a difference of 0.040%), Samoan (12.0%, a difference of 0.060%), and Navajo (12.0%, a difference of 0.070%).
| Demographics | Rating | Rank | Divorced or Separated |
| Austrians | 72.2 /100 | #153 | Good 12.0% |
| Chileans | 71.3 /100 | #154 | Good 12.0% |
| Japanese | 70.9 /100 | #155 | Good 12.0% |
| Hungarians | 70.3 /100 | #156 | Good 12.0% |
| Immigrants | Brazil | 68.8 /100 | #157 | Good 12.0% |
| Icelanders | 66.0 /100 | #158 | Good 12.0% |
| Immigrants | Barbados | 66.0 /100 | #159 | Good 12.0% |
| Immigrants | Scotland | 65.8 /100 | #160 | Good 12.0% |
| Marshallese | 64.6 /100 | #161 | Good 12.0% |
| Samoans | 64.3 /100 | #162 | Good 12.0% |
| Navajo | 63.9 /100 | #163 | Good 12.0% |
| Swiss | 63.6 /100 | #164 | Good 12.0% |
| German Russians | 61.8 /100 | #165 | Good 12.0% |
| Tohono O'odham | 60.4 /100 | #166 | Good 12.0% |
| Ethiopians | 58.5 /100 | #167 | Average 12.0% |