Blackfeet vs Immigrants from Scotland College, 1 year or more
COMPARE
Blackfeet
Immigrants from Scotland
College, 1 year or more
College, 1 year or more Comparison
Blackfeet
Immigrants from Scotland
54.6%
COLLEGE, 1 YEAR OR MORE
0.2/ 100
METRIC RATING
267th/ 347
METRIC RANK
63.4%
COLLEGE, 1 YEAR OR MORE
99.4/ 100
METRIC RATING
63rd/ 347
METRIC RANK
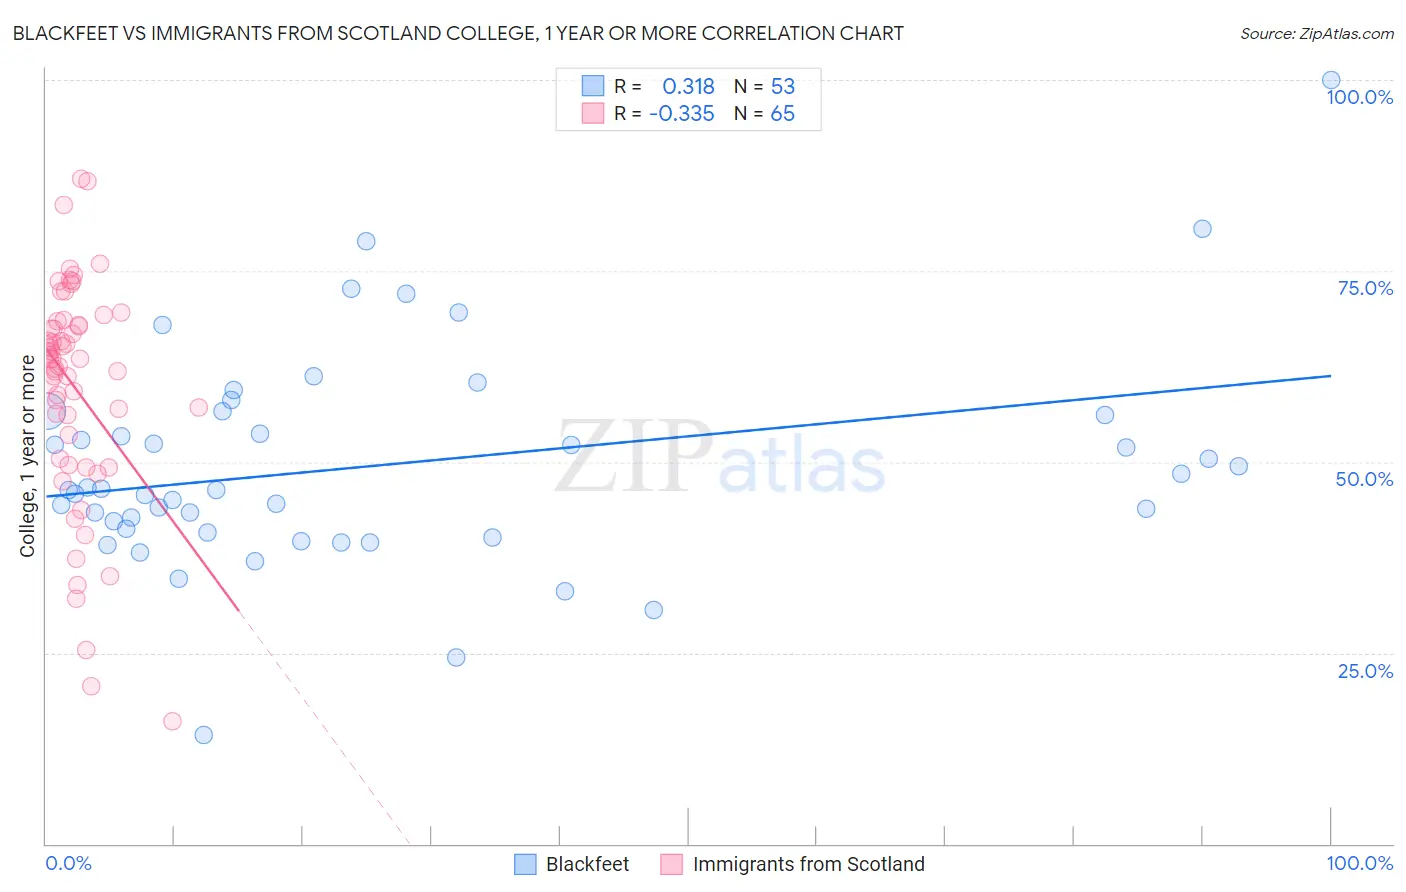
Blackfeet vs Immigrants from Scotland College, 1 year or more Correlation Chart
The statistical analysis conducted on geographies consisting of 309,581,710 people shows a mild positive correlation between the proportion of Blackfeet and percentage of population with at least college, 1 year or more education in the United States with a correlation coefficient (R) of 0.318 and weighted average of 54.6%. Similarly, the statistical analysis conducted on geographies consisting of 196,397,263 people shows a mild negative correlation between the proportion of Immigrants from Scotland and percentage of population with at least college, 1 year or more education in the United States with a correlation coefficient (R) of -0.335 and weighted average of 63.4%, a difference of 16.2%.
College, 1 year or more Correlation Summary
| Measurement | Blackfeet | Immigrants from Scotland |
| Minimum | 14.2% | 16.1% |
| Maximum | 100.0% | 87.1% |
| Range | 85.8% | 71.0% |
| Mean | 49.6% | 59.8% |
| Median | 46.3% | 63.6% |
| Interquartile 25% (IQ1) | 40.9% | 51.9% |
| Interquartile 75% (IQ3) | 56.4% | 68.2% |
| Interquartile Range (IQR) | 15.4% | 16.3% |
| Standard Deviation (Sample) | 14.4% | 14.6% |
| Standard Deviation (Population) | 14.3% | 14.5% |
Similar Demographics by College, 1 year or more
Demographics Similar to Blackfeet by College, 1 year or more
In terms of college, 1 year or more, the demographic groups most similar to Blackfeet are Potawatomi (54.6%, a difference of 0.070%), Immigrants from Laos (54.7%, a difference of 0.12%), British West Indian (54.5%, a difference of 0.16%), Bangladeshi (54.5%, a difference of 0.19%), and Crow (54.5%, a difference of 0.22%).
| Demographics | Rating | Rank | College, 1 year or more |
| Jamaicans | 0.3 /100 | #260 | Tragic 54.9% |
| Ottawa | 0.3 /100 | #261 | Tragic 54.9% |
| Immigrants | St. Vincent and the Grenadines | 0.3 /100 | #262 | Tragic 54.8% |
| U.S. Virgin Islanders | 0.3 /100 | #263 | Tragic 54.8% |
| Immigrants | Micronesia | 0.3 /100 | #264 | Tragic 54.8% |
| Immigrants | Laos | 0.2 /100 | #265 | Tragic 54.7% |
| Potawatomi | 0.2 /100 | #266 | Tragic 54.6% |
| Blackfeet | 0.2 /100 | #267 | Tragic 54.6% |
| British West Indians | 0.2 /100 | #268 | Tragic 54.5% |
| Bangladeshis | 0.2 /100 | #269 | Tragic 54.5% |
| Crow | 0.2 /100 | #270 | Tragic 54.5% |
| Bahamians | 0.2 /100 | #271 | Tragic 54.5% |
| Comanche | 0.2 /100 | #272 | Tragic 54.4% |
| Immigrants | Grenada | 0.2 /100 | #273 | Tragic 54.4% |
| Belizeans | 0.2 /100 | #274 | Tragic 54.4% |
Demographics Similar to Immigrants from Scotland by College, 1 year or more
In terms of college, 1 year or more, the demographic groups most similar to Immigrants from Scotland are Immigrants from Spain (63.4%, a difference of 0.030%), Immigrants from Indonesia (63.5%, a difference of 0.13%), Maltese (63.4%, a difference of 0.13%), Bolivian (63.5%, a difference of 0.14%), and Immigrants from Europe (63.3%, a difference of 0.24%).
| Demographics | Rating | Rank | College, 1 year or more |
| Immigrants | Czechoslovakia | 99.7 /100 | #56 | Exceptional 64.1% |
| South Africans | 99.7 /100 | #57 | Exceptional 64.1% |
| Immigrants | Asia | 99.7 /100 | #58 | Exceptional 64.0% |
| Immigrants | Serbia | 99.6 /100 | #59 | Exceptional 63.8% |
| Immigrants | Kazakhstan | 99.5 /100 | #60 | Exceptional 63.6% |
| Bolivians | 99.5 /100 | #61 | Exceptional 63.5% |
| Immigrants | Indonesia | 99.5 /100 | #62 | Exceptional 63.5% |
| Immigrants | Scotland | 99.4 /100 | #63 | Exceptional 63.4% |
| Immigrants | Spain | 99.4 /100 | #64 | Exceptional 63.4% |
| Maltese | 99.3 /100 | #65 | Exceptional 63.4% |
| Immigrants | Europe | 99.3 /100 | #66 | Exceptional 63.3% |
| Immigrants | Romania | 99.3 /100 | #67 | Exceptional 63.3% |
| Immigrants | Greece | 99.3 /100 | #68 | Exceptional 63.3% |
| Immigrants | Zimbabwe | 99.3 /100 | #69 | Exceptional 63.3% |
| Argentineans | 99.2 /100 | #70 | Exceptional 63.2% |