Immigrants from Austria vs Immigrants from Bulgaria Single Father Households
COMPARE
Immigrants from Austria
Immigrants from Bulgaria
Single Father Households
Single Father Households Comparison
Immigrants from Austria
Immigrants from Bulgaria
2.0%
SINGLE FATHER HOUSEHOLDS
99.9/ 100
METRIC RATING
60th/ 347
METRIC RANK
2.0%
SINGLE FATHER HOUSEHOLDS
100.0/ 100
METRIC RATING
40th/ 347
METRIC RANK
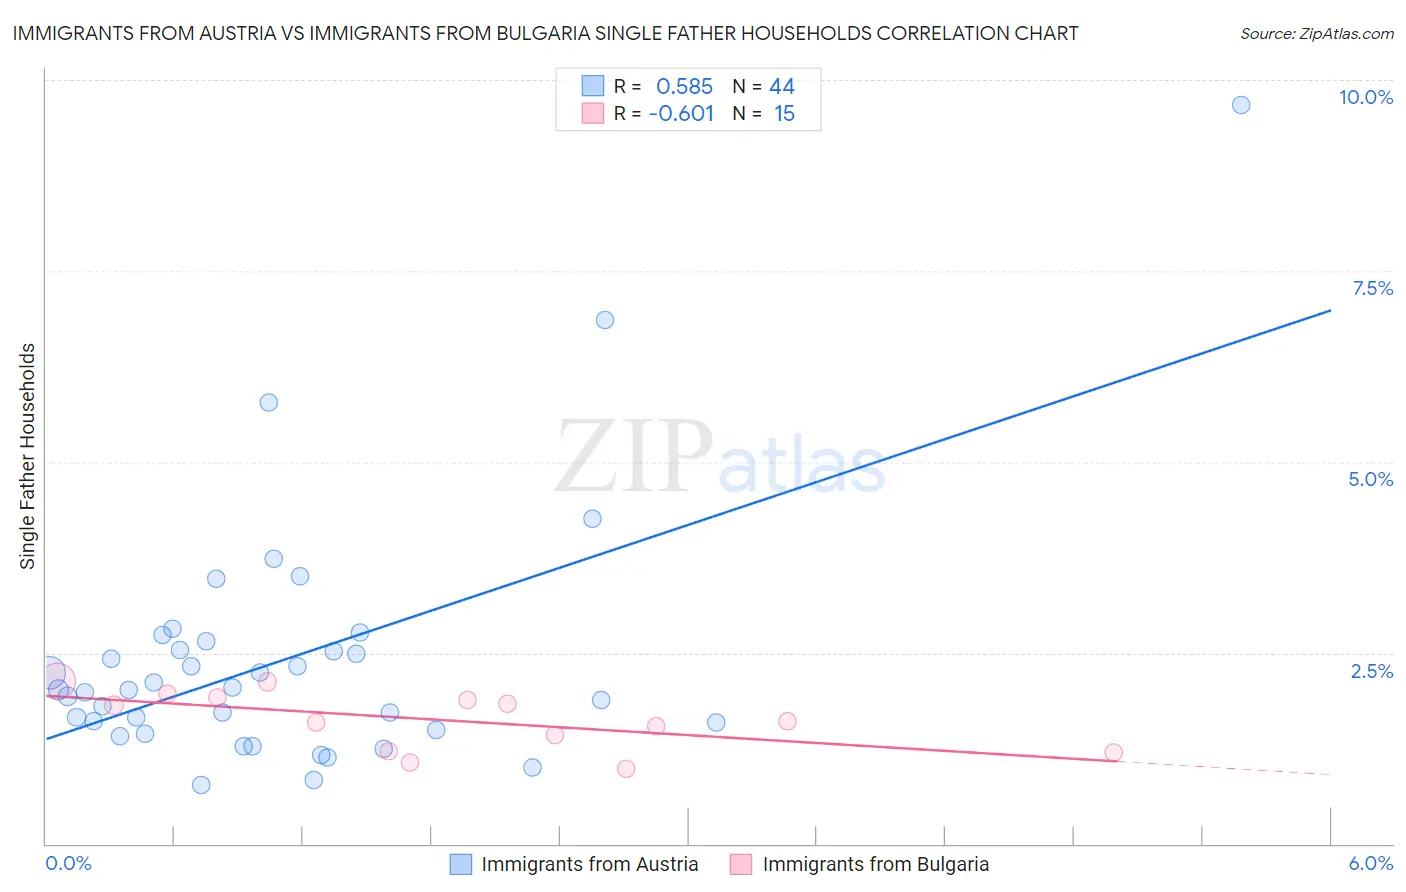
Immigrants from Austria vs Immigrants from Bulgaria Single Father Households Correlation Chart
The statistical analysis conducted on geographies consisting of 166,908,131 people shows a substantial positive correlation between the proportion of Immigrants from Austria and percentage of single father households in the United States with a correlation coefficient (R) of 0.585 and weighted average of 2.0%. Similarly, the statistical analysis conducted on geographies consisting of 172,048,357 people shows a significant negative correlation between the proportion of Immigrants from Bulgaria and percentage of single father households in the United States with a correlation coefficient (R) of -0.601 and weighted average of 2.0%, a difference of 2.2%.
Single Father Households Correlation Summary
| Measurement | Immigrants from Austria | Immigrants from Bulgaria |
| Minimum | 0.78% | 0.98% |
| Maximum | 9.7% | 2.1% |
| Range | 8.9% | 1.1% |
| Mean | 2.4% | 1.6% |
| Median | 2.0% | 1.6% |
| Interquartile 25% (IQ1) | 1.5% | 1.2% |
| Interquartile 75% (IQ3) | 2.6% | 1.9% |
| Interquartile Range (IQR) | 1.1% | 0.70% |
| Standard Deviation (Sample) | 1.6% | 0.37% |
| Standard Deviation (Population) | 1.6% | 0.36% |
Demographics Similar to Immigrants from Austria and Immigrants from Bulgaria by Single Father Households
In terms of single father households, the demographic groups most similar to Immigrants from Austria are Immigrants from North Macedonia (2.0%, a difference of 0.010%), Immigrants from Czechoslovakia (2.0%, a difference of 0.11%), Burmese (2.0%, a difference of 0.14%), Immigrants from Norway (2.0%, a difference of 0.40%), and Immigrants from France (2.0%, a difference of 0.42%). Similarly, the demographic groups most similar to Immigrants from Bulgaria are Immigrants from Turkey (2.0%, a difference of 0.18%), Macedonian (2.0%, a difference of 0.33%), Immigrants from Grenada (2.0%, a difference of 0.56%), Latvian (2.0%, a difference of 0.64%), and Russian (2.0%, a difference of 0.66%).
| Demographics | Rating | Rank | Single Father Households |
| Immigrants | Bulgaria | 100.0 /100 | #40 | Exceptional 2.0% |
| Immigrants | Turkey | 100.0 /100 | #41 | Exceptional 2.0% |
| Macedonians | 100.0 /100 | #42 | Exceptional 2.0% |
| Immigrants | Grenada | 100.0 /100 | #43 | Exceptional 2.0% |
| Latvians | 100.0 /100 | #44 | Exceptional 2.0% |
| Russians | 100.0 /100 | #45 | Exceptional 2.0% |
| Immigrants | Lebanon | 100.0 /100 | #46 | Exceptional 2.0% |
| Immigrants | Ukraine | 99.9 /100 | #47 | Exceptional 2.0% |
| Immigrants | Kazakhstan | 99.9 /100 | #48 | Exceptional 2.0% |
| Immigrants | Serbia | 99.9 /100 | #49 | Exceptional 2.0% |
| Immigrants | Switzerland | 99.9 /100 | #50 | Exceptional 2.0% |
| Immigrants | Poland | 99.9 /100 | #51 | Exceptional 2.0% |
| Immigrants | Europe | 99.9 /100 | #52 | Exceptional 2.0% |
| Immigrants | Northern Europe | 99.9 /100 | #53 | Exceptional 2.0% |
| Immigrants | Korea | 99.9 /100 | #54 | Exceptional 2.0% |
| Immigrants | France | 99.9 /100 | #55 | Exceptional 2.0% |
| Immigrants | Norway | 99.9 /100 | #56 | Exceptional 2.0% |
| Burmese | 99.9 /100 | #57 | Exceptional 2.0% |
| Immigrants | Czechoslovakia | 99.9 /100 | #58 | Exceptional 2.0% |
| Immigrants | North Macedonia | 99.9 /100 | #59 | Exceptional 2.0% |
| Immigrants | Austria | 99.9 /100 | #60 | Exceptional 2.0% |