Bermudan vs Lumbee Family Households
COMPARE
Bermudan
Lumbee
Family Households
Family Households Comparison
Bermudans
Lumbee
62.2%
FAMILY HOUSEHOLDS
0.0/ 100
METRIC RATING
305th/ 347
METRIC RANK
63.1%
FAMILY HOUSEHOLDS
0.3/ 100
METRIC RATING
274th/ 347
METRIC RANK
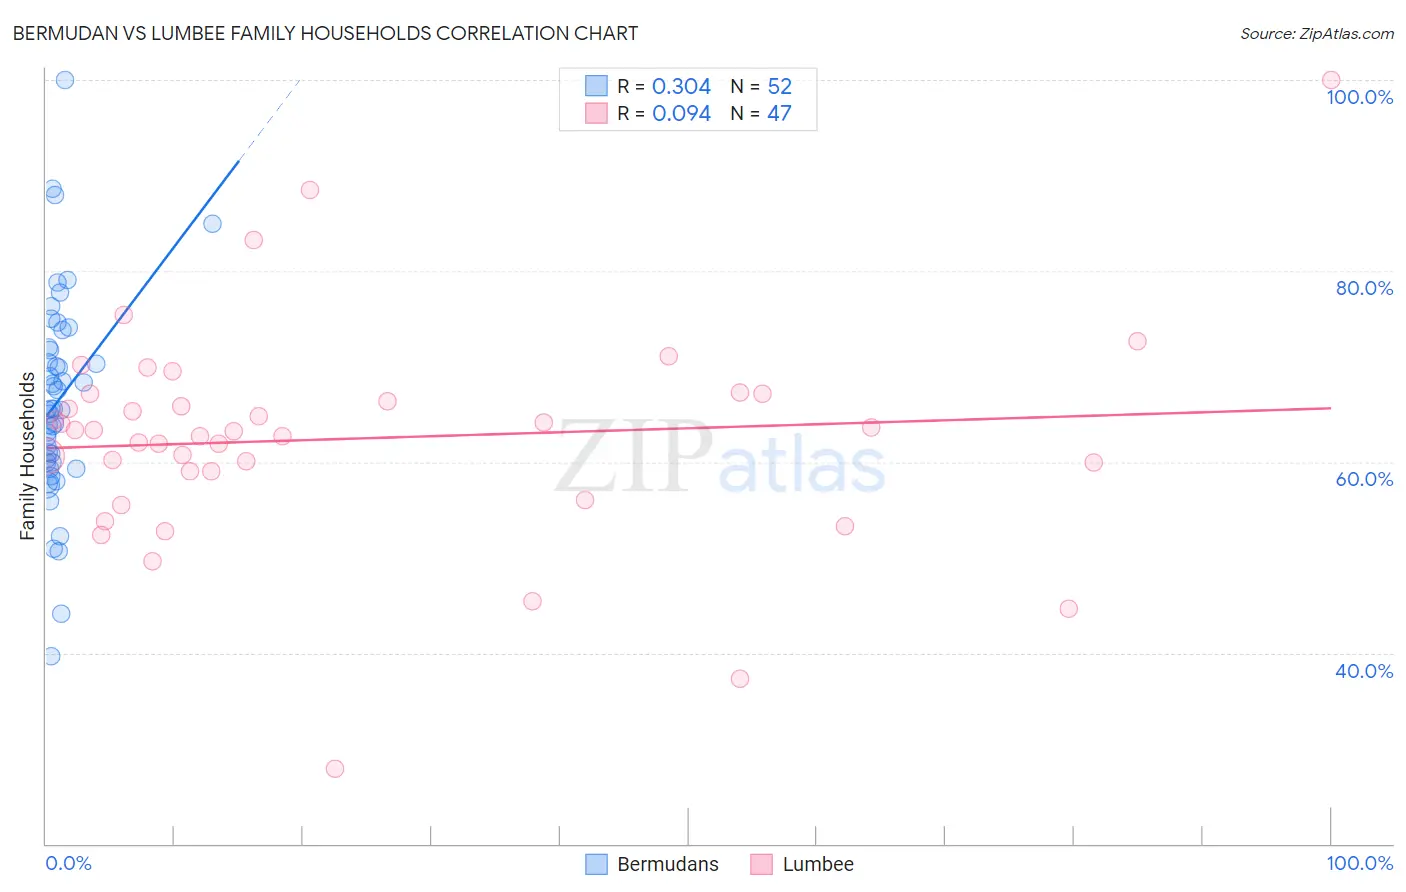
Bermudan vs Lumbee Family Households Correlation Chart
The statistical analysis conducted on geographies consisting of 55,716,623 people shows a mild positive correlation between the proportion of Bermudans and percentage of family households in the United States with a correlation coefficient (R) of 0.304 and weighted average of 62.2%. Similarly, the statistical analysis conducted on geographies consisting of 92,265,071 people shows a slight positive correlation between the proportion of Lumbee and percentage of family households in the United States with a correlation coefficient (R) of 0.094 and weighted average of 63.1%, a difference of 1.5%.
Family Households Correlation Summary
| Measurement | Bermudan | Lumbee |
| Minimum | 39.6% | 27.9% |
| Maximum | 100.0% | 100.0% |
| Range | 60.4% | 72.1% |
| Mean | 66.5% | 62.4% |
| Median | 65.5% | 63.1% |
| Interquartile 25% (IQ1) | 59.9% | 59.0% |
| Interquartile 75% (IQ3) | 71.8% | 67.2% |
| Interquartile Range (IQR) | 11.9% | 8.2% |
| Standard Deviation (Sample) | 10.9% | 11.7% |
| Standard Deviation (Population) | 10.8% | 11.5% |
Similar Demographics by Family Households
Demographics Similar to Bermudans by Family Households
In terms of family households, the demographic groups most similar to Bermudans are African (62.1%, a difference of 0.020%), Immigrants from Norway (62.1%, a difference of 0.10%), Chippewa (62.1%, a difference of 0.10%), Iroquois (62.2%, a difference of 0.15%), and Subsaharan African (62.1%, a difference of 0.16%).
| Demographics | Rating | Rank | Family Households |
| Immigrants | Spain | 0.0 /100 | #298 | Tragic 62.4% |
| Immigrants | Kuwait | 0.0 /100 | #299 | Tragic 62.4% |
| Immigrants | Africa | 0.0 /100 | #300 | Tragic 62.4% |
| Immigrants | Albania | 0.0 /100 | #301 | Tragic 62.4% |
| Immigrants | Kenya | 0.0 /100 | #302 | Tragic 62.3% |
| Cree | 0.0 /100 | #303 | Tragic 62.3% |
| Iroquois | 0.0 /100 | #304 | Tragic 62.2% |
| Bermudans | 0.0 /100 | #305 | Tragic 62.2% |
| Africans | 0.0 /100 | #306 | Tragic 62.1% |
| Immigrants | Norway | 0.0 /100 | #307 | Tragic 62.1% |
| Chippewa | 0.0 /100 | #308 | Tragic 62.1% |
| Sub-Saharan Africans | 0.0 /100 | #309 | Tragic 62.1% |
| Immigrants | Liberia | 0.0 /100 | #310 | Tragic 62.0% |
| Immigrants | Morocco | 0.0 /100 | #311 | Tragic 62.0% |
| Immigrants | Latvia | 0.0 /100 | #312 | Tragic 62.0% |
Demographics Similar to Lumbee by Family Households
In terms of family households, the demographic groups most similar to Lumbee are West Indian (63.1%, a difference of 0.0%), Immigrants from Kazakhstan (63.1%, a difference of 0.010%), Serbian (63.0%, a difference of 0.010%), Immigrants from Croatia (63.1%, a difference of 0.020%), and Immigrants from Turkey (63.1%, a difference of 0.020%).
| Demographics | Rating | Rank | Family Households |
| Israelis | 0.4 /100 | #267 | Tragic 63.1% |
| Immigrants | Singapore | 0.4 /100 | #268 | Tragic 63.1% |
| Yugoslavians | 0.4 /100 | #269 | Tragic 63.1% |
| Immigrants | Austria | 0.3 /100 | #270 | Tragic 63.1% |
| Immigrants | Croatia | 0.3 /100 | #271 | Tragic 63.1% |
| Immigrants | Turkey | 0.3 /100 | #272 | Tragic 63.1% |
| Immigrants | Kazakhstan | 0.3 /100 | #273 | Tragic 63.1% |
| Lumbee | 0.3 /100 | #274 | Tragic 63.1% |
| West Indians | 0.3 /100 | #275 | Tragic 63.1% |
| Serbians | 0.3 /100 | #276 | Tragic 63.0% |
| Ottawa | 0.3 /100 | #277 | Tragic 63.0% |
| Immigrants | Belgium | 0.2 /100 | #278 | Tragic 63.0% |
| Immigrants | Yemen | 0.2 /100 | #279 | Tragic 63.0% |
| Immigrants | Bulgaria | 0.2 /100 | #280 | Tragic 63.0% |
| Estonians | 0.2 /100 | #281 | Tragic 62.9% |