Bermudan vs Pennsylvania German Family Households
COMPARE
Bermudan
Pennsylvania German
Family Households
Family Households Comparison
Bermudans
Pennsylvania Germans
62.2%
FAMILY HOUSEHOLDS
0.0/ 100
METRIC RATING
305th/ 347
METRIC RANK
66.1%
FAMILY HOUSEHOLDS
100.0/ 100
METRIC RATING
57th/ 347
METRIC RANK
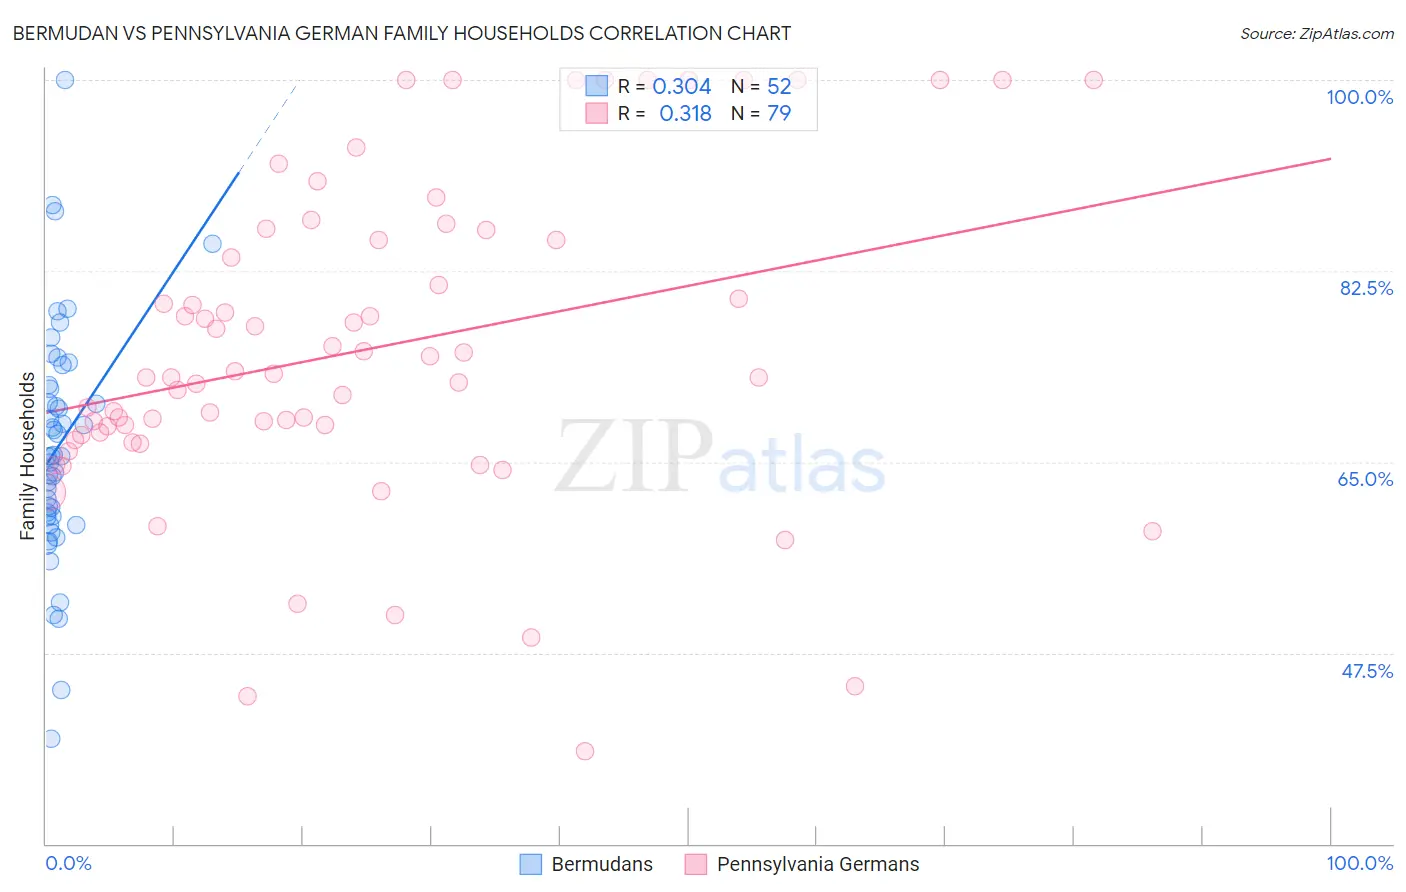
Bermudan vs Pennsylvania German Family Households Correlation Chart
The statistical analysis conducted on geographies consisting of 55,716,623 people shows a mild positive correlation between the proportion of Bermudans and percentage of family households in the United States with a correlation coefficient (R) of 0.304 and weighted average of 62.2%. Similarly, the statistical analysis conducted on geographies consisting of 234,061,495 people shows a mild positive correlation between the proportion of Pennsylvania Germans and percentage of family households in the United States with a correlation coefficient (R) of 0.318 and weighted average of 66.1%, a difference of 6.4%.
Family Households Correlation Summary
| Measurement | Bermudan | Pennsylvania German |
| Minimum | 39.6% | 38.5% |
| Maximum | 100.0% | 100.0% |
| Range | 60.4% | 61.5% |
| Mean | 66.5% | 75.3% |
| Median | 65.5% | 72.8% |
| Interquartile 25% (IQ1) | 59.9% | 67.5% |
| Interquartile 75% (IQ3) | 71.8% | 85.4% |
| Interquartile Range (IQR) | 11.9% | 17.9% |
| Standard Deviation (Sample) | 10.9% | 14.5% |
| Standard Deviation (Population) | 10.8% | 14.4% |
Similar Demographics by Family Households
Demographics Similar to Bermudans by Family Households
In terms of family households, the demographic groups most similar to Bermudans are African (62.1%, a difference of 0.020%), Immigrants from Norway (62.1%, a difference of 0.10%), Chippewa (62.1%, a difference of 0.10%), Iroquois (62.2%, a difference of 0.15%), and Subsaharan African (62.1%, a difference of 0.16%).
| Demographics | Rating | Rank | Family Households |
| Immigrants | Spain | 0.0 /100 | #298 | Tragic 62.4% |
| Immigrants | Kuwait | 0.0 /100 | #299 | Tragic 62.4% |
| Immigrants | Africa | 0.0 /100 | #300 | Tragic 62.4% |
| Immigrants | Albania | 0.0 /100 | #301 | Tragic 62.4% |
| Immigrants | Kenya | 0.0 /100 | #302 | Tragic 62.3% |
| Cree | 0.0 /100 | #303 | Tragic 62.3% |
| Iroquois | 0.0 /100 | #304 | Tragic 62.2% |
| Bermudans | 0.0 /100 | #305 | Tragic 62.2% |
| Africans | 0.0 /100 | #306 | Tragic 62.1% |
| Immigrants | Norway | 0.0 /100 | #307 | Tragic 62.1% |
| Chippewa | 0.0 /100 | #308 | Tragic 62.1% |
| Sub-Saharan Africans | 0.0 /100 | #309 | Tragic 62.1% |
| Immigrants | Liberia | 0.0 /100 | #310 | Tragic 62.0% |
| Immigrants | Morocco | 0.0 /100 | #311 | Tragic 62.0% |
| Immigrants | Latvia | 0.0 /100 | #312 | Tragic 62.0% |
Demographics Similar to Pennsylvania Germans by Family Households
In terms of family households, the demographic groups most similar to Pennsylvania Germans are Immigrants from Hong Kong (66.1%, a difference of 0.020%), Immigrants (66.1%, a difference of 0.030%), Immigrants from Asia (66.1%, a difference of 0.11%), Immigrants from Korea (66.0%, a difference of 0.12%), and South American (66.0%, a difference of 0.13%).
| Demographics | Rating | Rank | Family Households |
| Navajo | 100.0 /100 | #50 | Exceptional 66.4% |
| Natives/Alaskans | 100.0 /100 | #51 | Exceptional 66.4% |
| Colombians | 100.0 /100 | #52 | Exceptional 66.3% |
| Afghans | 100.0 /100 | #53 | Exceptional 66.3% |
| Immigrants | Colombia | 100.0 /100 | #54 | Exceptional 66.3% |
| Immigrants | Immigrants | 100.0 /100 | #55 | Exceptional 66.1% |
| Immigrants | Hong Kong | 100.0 /100 | #56 | Exceptional 66.1% |
| Pennsylvania Germans | 100.0 /100 | #57 | Exceptional 66.1% |
| Immigrants | Asia | 100.0 /100 | #58 | Exceptional 66.1% |
| Immigrants | Korea | 100.0 /100 | #59 | Exceptional 66.0% |
| South Americans | 100.0 /100 | #60 | Exceptional 66.0% |
| Danes | 100.0 /100 | #61 | Exceptional 66.0% |
| Central Americans | 100.0 /100 | #62 | Exceptional 66.0% |
| Immigrants | Indonesia | 100.0 /100 | #63 | Exceptional 66.0% |
| Pima | 99.9 /100 | #64 | Exceptional 65.9% |