Belizean vs Albanian Female Unemployment
COMPARE
Belizean
Albanian
Female Unemployment
Female Unemployment Comparison
Belizeans
Albanians
6.3%
FEMALE UNEMPLOYMENT
0.0/ 100
METRIC RATING
313th/ 347
METRIC RANK
5.2%
FEMALE UNEMPLOYMENT
68.3/ 100
METRIC RATING
158th/ 347
METRIC RANK
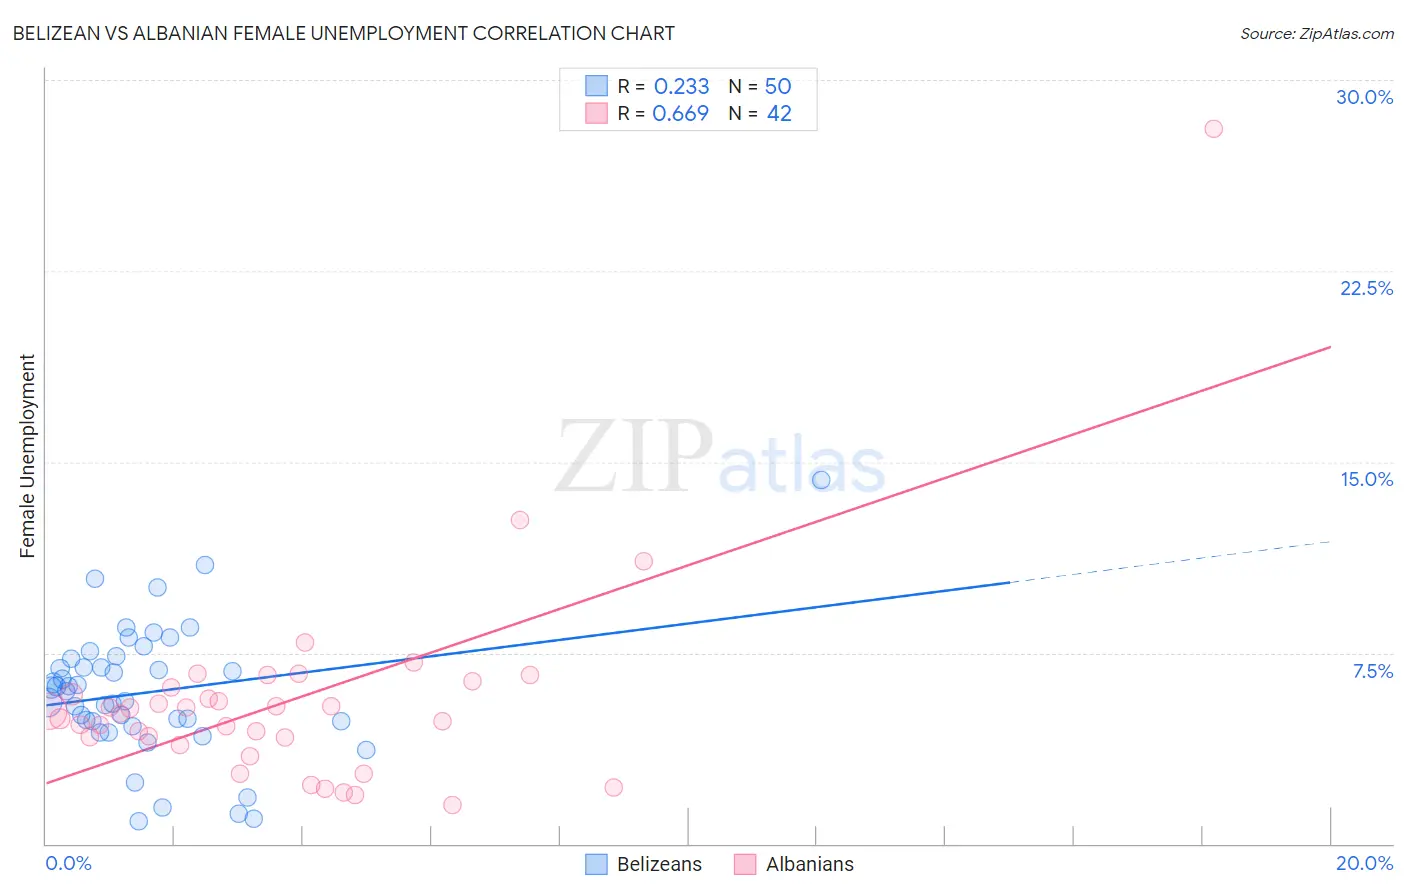
Belizean vs Albanian Female Unemployment Correlation Chart
The statistical analysis conducted on geographies consisting of 144,062,837 people shows a weak positive correlation between the proportion of Belizeans and unemploymnet rate among females in the United States with a correlation coefficient (R) of 0.233 and weighted average of 6.3%. Similarly, the statistical analysis conducted on geographies consisting of 192,822,109 people shows a significant positive correlation between the proportion of Albanians and unemploymnet rate among females in the United States with a correlation coefficient (R) of 0.669 and weighted average of 5.2%, a difference of 22.1%.
Female Unemployment Correlation Summary
| Measurement | Belizean | Albanian |
| Minimum | 0.90% | 1.5% |
| Maximum | 14.3% | 28.1% |
| Range | 13.4% | 26.6% |
| Mean | 6.0% | 5.6% |
| Median | 6.1% | 5.2% |
| Interquartile 25% (IQ1) | 4.8% | 4.2% |
| Interquartile 75% (IQ3) | 7.3% | 6.1% |
| Interquartile Range (IQR) | 2.5% | 1.9% |
| Standard Deviation (Sample) | 2.6% | 4.2% |
| Standard Deviation (Population) | 2.5% | 4.1% |
Similar Demographics by Female Unemployment
Demographics Similar to Belizeans by Female Unemployment
In terms of female unemployment, the demographic groups most similar to Belizeans are Immigrants from Grenada (6.3%, a difference of 0.010%), Immigrants from Ecuador (6.4%, a difference of 0.23%), Pueblo (6.4%, a difference of 0.54%), Immigrants from Mexico (6.3%, a difference of 0.67%), and Central American Indian (6.3%, a difference of 0.81%).
| Demographics | Rating | Rank | Female Unemployment |
| Immigrants | Central America | 0.0 /100 | #306 | Tragic 6.2% |
| Shoshone | 0.0 /100 | #307 | Tragic 6.2% |
| Hispanics or Latinos | 0.0 /100 | #308 | Tragic 6.2% |
| Ecuadorians | 0.0 /100 | #309 | Tragic 6.3% |
| Central American Indians | 0.0 /100 | #310 | Tragic 6.3% |
| Immigrants | Mexico | 0.0 /100 | #311 | Tragic 6.3% |
| Immigrants | Grenada | 0.0 /100 | #312 | Tragic 6.3% |
| Belizeans | 0.0 /100 | #313 | Tragic 6.3% |
| Immigrants | Ecuador | 0.0 /100 | #314 | Tragic 6.4% |
| Pueblo | 0.0 /100 | #315 | Tragic 6.4% |
| Houma | 0.0 /100 | #316 | Tragic 6.4% |
| Immigrants | St. Vincent and the Grenadines | 0.0 /100 | #317 | Tragic 6.4% |
| British West Indians | 0.0 /100 | #318 | Tragic 6.4% |
| Immigrants | Bangladesh | 0.0 /100 | #319 | Tragic 6.5% |
| Immigrants | Dominica | 0.0 /100 | #320 | Tragic 6.5% |
Demographics Similar to Albanians by Female Unemployment
In terms of female unemployment, the demographic groups most similar to Albanians are Immigrants from Russia (5.2%, a difference of 0.070%), Immigrants from Northern Africa (5.2%, a difference of 0.10%), Immigrants from Micronesia (5.2%, a difference of 0.10%), Immigrants from Spain (5.2%, a difference of 0.11%), and Immigrants from Pakistan (5.2%, a difference of 0.11%).
| Demographics | Rating | Rank | Female Unemployment |
| Immigrants | China | 75.9 /100 | #151 | Good 5.2% |
| Immigrants | Italy | 75.0 /100 | #152 | Good 5.2% |
| Immigrants | Greece | 74.9 /100 | #153 | Good 5.2% |
| South Africans | 70.8 /100 | #154 | Good 5.2% |
| Immigrants | Egypt | 70.0 /100 | #155 | Good 5.2% |
| Immigrants | Northern Africa | 69.6 /100 | #156 | Good 5.2% |
| Immigrants | Russia | 69.3 /100 | #157 | Good 5.2% |
| Albanians | 68.3 /100 | #158 | Good 5.2% |
| Immigrants | Micronesia | 66.9 /100 | #159 | Good 5.2% |
| Immigrants | Spain | 66.8 /100 | #160 | Good 5.2% |
| Immigrants | Pakistan | 66.7 /100 | #161 | Good 5.2% |
| Potawatomi | 65.9 /100 | #162 | Good 5.2% |
| Immigrants | Asia | 64.3 /100 | #163 | Good 5.2% |
| Bangladeshis | 64.3 /100 | #164 | Good 5.2% |
| Syrians | 62.8 /100 | #165 | Good 5.2% |