Immigrants from Eastern Europe vs Immigrants from England Currently Married
COMPARE
Immigrants from Eastern Europe
Immigrants from England
Currently Married
Currently Married Comparison
Immigrants from Eastern Europe
Immigrants from England
48.0%
CURRENTLY MARRIED
96.1/ 100
METRIC RATING
88th/ 347
METRIC RANK
48.3%
CURRENTLY MARRIED
98.2/ 100
METRIC RATING
68th/ 347
METRIC RANK
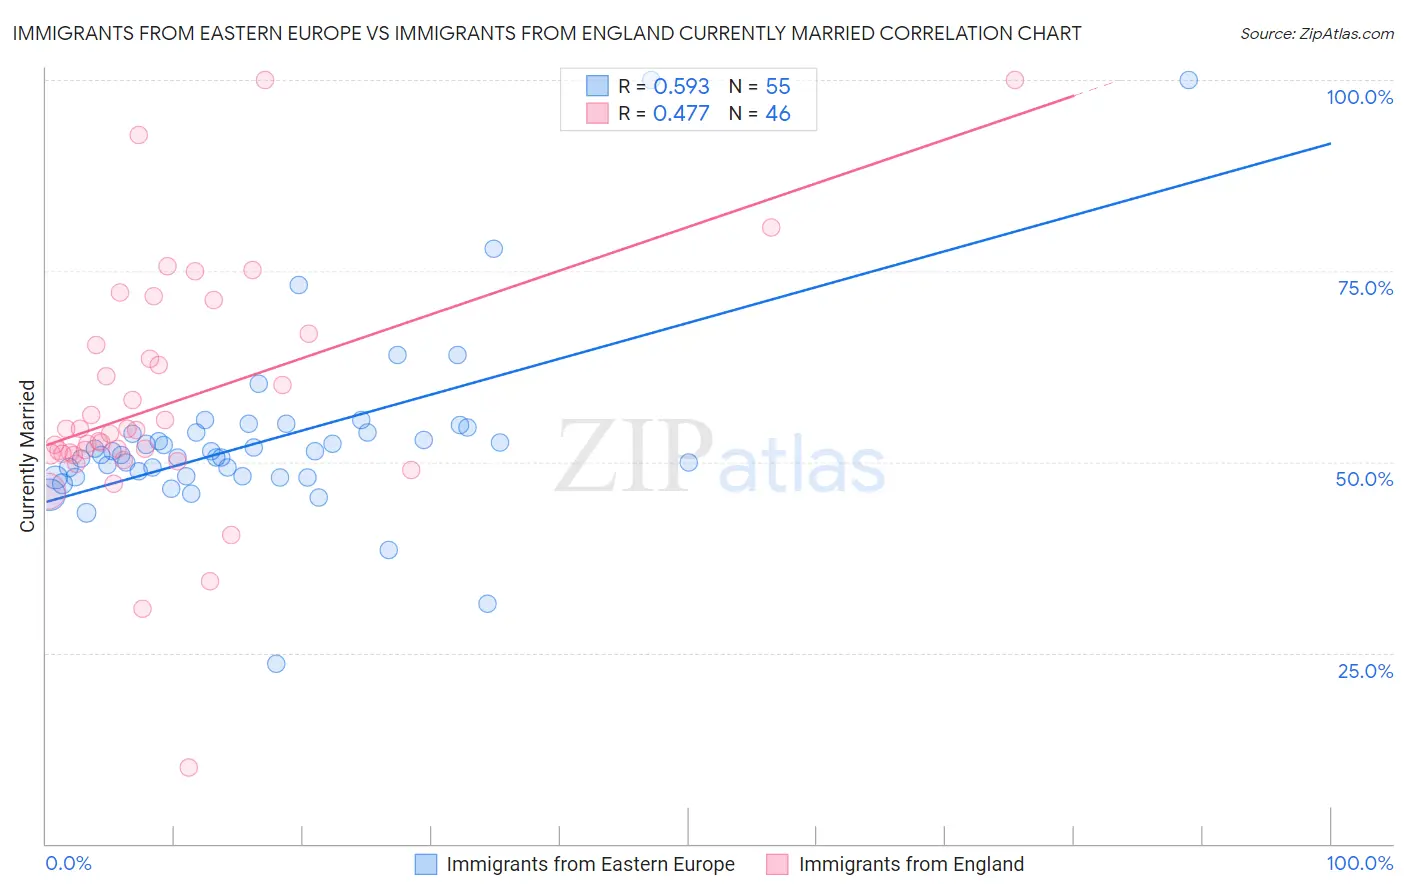
Immigrants from Eastern Europe vs Immigrants from England Currently Married Correlation Chart
The statistical analysis conducted on geographies consisting of 475,818,716 people shows a substantial positive correlation between the proportion of Immigrants from Eastern Europe and percentage of population currently married in the United States with a correlation coefficient (R) of 0.593 and weighted average of 48.0%. Similarly, the statistical analysis conducted on geographies consisting of 391,864,919 people shows a moderate positive correlation between the proportion of Immigrants from England and percentage of population currently married in the United States with a correlation coefficient (R) of 0.477 and weighted average of 48.3%, a difference of 0.69%.
Currently Married Correlation Summary
| Measurement | Immigrants from Eastern Europe | Immigrants from England |
| Minimum | 23.5% | 10.0% |
| Maximum | 100.0% | 100.0% |
| Range | 76.5% | 90.0% |
| Mean | 52.9% | 57.9% |
| Median | 50.9% | 54.0% |
| Interquartile 25% (IQ1) | 48.1% | 51.0% |
| Interquartile 75% (IQ3) | 53.9% | 65.3% |
| Interquartile Range (IQR) | 5.9% | 14.3% |
| Standard Deviation (Sample) | 12.1% | 16.3% |
| Standard Deviation (Population) | 12.0% | 16.1% |
Demographics Similar to Immigrants from Eastern Europe and Immigrants from England by Currently Married
In terms of currently married, the demographic groups most similar to Immigrants from Eastern Europe are Jordanian (48.0%, a difference of 0.020%), Immigrants from Japan (48.0%, a difference of 0.030%), French Canadian (48.0%, a difference of 0.060%), Bolivian (48.1%, a difference of 0.20%), and Immigrants from Israel (48.1%, a difference of 0.20%). Similarly, the demographic groups most similar to Immigrants from England are Canadian (48.3%, a difference of 0.020%), Immigrants from Asia (48.3%, a difference of 0.10%), Macedonian (48.3%, a difference of 0.11%), Immigrants from Lebanon (48.2%, a difference of 0.25%), and Immigrants from Eastern Asia (48.2%, a difference of 0.28%).
| Demographics | Rating | Rank | Currently Married |
| Immigrants | England | 98.2 /100 | #68 | Exceptional 48.3% |
| Canadians | 98.1 /100 | #69 | Exceptional 48.3% |
| Immigrants | Asia | 97.9 /100 | #70 | Exceptional 48.3% |
| Macedonians | 97.9 /100 | #71 | Exceptional 48.3% |
| Immigrants | Lebanon | 97.6 /100 | #72 | Exceptional 48.2% |
| Immigrants | Eastern Asia | 97.5 /100 | #73 | Exceptional 48.2% |
| Estonians | 97.4 /100 | #74 | Exceptional 48.2% |
| Immigrants | Belarus | 97.2 /100 | #75 | Exceptional 48.1% |
| Basques | 97.2 /100 | #76 | Exceptional 48.1% |
| Slovenes | 97.1 /100 | #77 | Exceptional 48.1% |
| Immigrants | Belgium | 97.1 /100 | #78 | Exceptional 48.1% |
| Immigrants | South Africa | 97.0 /100 | #79 | Exceptional 48.1% |
| Immigrants | Poland | 96.9 /100 | #80 | Exceptional 48.1% |
| Immigrants | Sri Lanka | 96.9 /100 | #81 | Exceptional 48.1% |
| Immigrants | Europe | 96.9 /100 | #82 | Exceptional 48.1% |
| Bolivians | 96.9 /100 | #83 | Exceptional 48.1% |
| Immigrants | Israel | 96.9 /100 | #84 | Exceptional 48.1% |
| French Canadians | 96.3 /100 | #85 | Exceptional 48.0% |
| Immigrants | Japan | 96.2 /100 | #86 | Exceptional 48.0% |
| Jordanians | 96.2 /100 | #87 | Exceptional 48.0% |
| Immigrants | Eastern Europe | 96.1 /100 | #88 | Exceptional 48.0% |