Belgian vs Immigrants from England Cognitive Disability
COMPARE
Belgian
Immigrants from England
Cognitive Disability
Cognitive Disability Comparison
Belgians
Immigrants from England
16.7%
COGNITIVE DISABILITY
99.1/ 100
METRIC RATING
84th/ 347
METRIC RANK
16.6%
COGNITIVE DISABILITY
99.6/ 100
METRIC RATING
61st/ 347
METRIC RANK
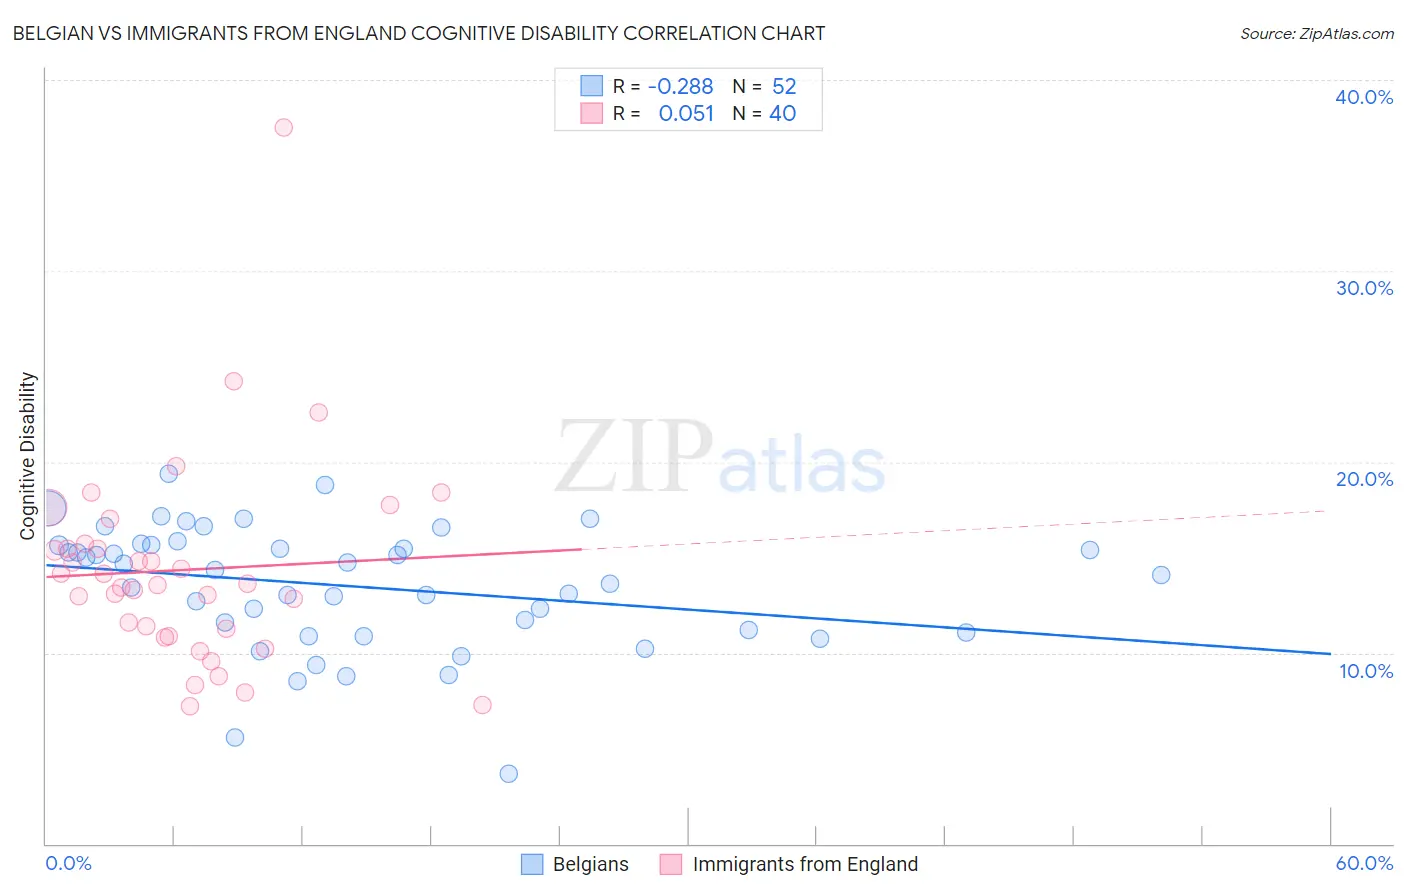
Belgian vs Immigrants from England Cognitive Disability Correlation Chart
The statistical analysis conducted on geographies consisting of 355,993,312 people shows a weak negative correlation between the proportion of Belgians and percentage of population with cognitive disability in the United States with a correlation coefficient (R) of -0.288 and weighted average of 16.7%. Similarly, the statistical analysis conducted on geographies consisting of 391,893,945 people shows a slight positive correlation between the proportion of Immigrants from England and percentage of population with cognitive disability in the United States with a correlation coefficient (R) of 0.051 and weighted average of 16.6%, a difference of 0.65%.
Cognitive Disability Correlation Summary
| Measurement | Belgian | Immigrants from England |
| Minimum | 3.7% | 7.2% |
| Maximum | 19.4% | 37.5% |
| Range | 15.7% | 30.3% |
| Mean | 13.5% | 14.3% |
| Median | 14.2% | 13.6% |
| Interquartile 25% (IQ1) | 11.1% | 11.1% |
| Interquartile 75% (IQ3) | 15.6% | 15.6% |
| Interquartile Range (IQR) | 4.5% | 4.5% |
| Standard Deviation (Sample) | 3.2% | 5.4% |
| Standard Deviation (Population) | 3.2% | 5.3% |
Similar Demographics by Cognitive Disability
Demographics Similar to Belgians by Cognitive Disability
In terms of cognitive disability, the demographic groups most similar to Belgians are Serbian (16.7%, a difference of 0.020%), Immigrants from Moldova (16.7%, a difference of 0.020%), Immigrants from South Africa (16.7%, a difference of 0.050%), Native Hawaiian (16.7%, a difference of 0.060%), and Swiss (16.7%, a difference of 0.090%).
| Demographics | Rating | Rank | Cognitive Disability |
| Immigrants | Hungary | 99.3 /100 | #77 | Exceptional 16.7% |
| Peruvians | 99.3 /100 | #78 | Exceptional 16.7% |
| Immigrants | Bulgaria | 99.3 /100 | #79 | Exceptional 16.7% |
| Egyptians | 99.2 /100 | #80 | Exceptional 16.7% |
| Immigrants | Netherlands | 99.2 /100 | #81 | Exceptional 16.7% |
| Swiss | 99.2 /100 | #82 | Exceptional 16.7% |
| Serbians | 99.1 /100 | #83 | Exceptional 16.7% |
| Belgians | 99.1 /100 | #84 | Exceptional 16.7% |
| Immigrants | Moldova | 99.1 /100 | #85 | Exceptional 16.7% |
| Immigrants | South Africa | 99.0 /100 | #86 | Exceptional 16.7% |
| Native Hawaiians | 99.0 /100 | #87 | Exceptional 16.7% |
| Immigrants | Philippines | 99.0 /100 | #88 | Exceptional 16.7% |
| Immigrants | Egypt | 98.8 /100 | #89 | Exceptional 16.7% |
| South Americans | 98.8 /100 | #90 | Exceptional 16.7% |
| Danes | 98.8 /100 | #91 | Exceptional 16.7% |
Demographics Similar to Immigrants from England by Cognitive Disability
In terms of cognitive disability, the demographic groups most similar to Immigrants from England are Czechoslovakian (16.6%, a difference of 0.030%), Argentinean (16.6%, a difference of 0.050%), Romanian (16.6%, a difference of 0.060%), Pennsylvania German (16.6%, a difference of 0.070%), and Immigrants from Peru (16.6%, a difference of 0.070%).
| Demographics | Rating | Rank | Cognitive Disability |
| Immigrants | Iran | 99.8 /100 | #54 | Exceptional 16.5% |
| Immigrants | Venezuela | 99.7 /100 | #55 | Exceptional 16.5% |
| Austrians | 99.7 /100 | #56 | Exceptional 16.6% |
| Bhutanese | 99.7 /100 | #57 | Exceptional 16.6% |
| Pennsylvania Germans | 99.7 /100 | #58 | Exceptional 16.6% |
| Immigrants | Peru | 99.7 /100 | #59 | Exceptional 16.6% |
| Romanians | 99.7 /100 | #60 | Exceptional 16.6% |
| Immigrants | England | 99.6 /100 | #61 | Exceptional 16.6% |
| Czechoslovakians | 99.6 /100 | #62 | Exceptional 16.6% |
| Argentineans | 99.6 /100 | #63 | Exceptional 16.6% |
| Venezuelans | 99.6 /100 | #64 | Exceptional 16.6% |
| Colombians | 99.6 /100 | #65 | Exceptional 16.6% |
| Immigrants | Ukraine | 99.5 /100 | #66 | Exceptional 16.6% |
| Latvians | 99.5 /100 | #67 | Exceptional 16.6% |
| Ukrainians | 99.4 /100 | #68 | Exceptional 16.6% |