Basque vs White/Caucasian Average Family Size
COMPARE
Basque
White/Caucasian
Average Family Size
Average Family Size Comparison
Basques
Whites/Caucasians
3.19
AVERAGE FAMILY SIZE
5.2/ 100
METRIC RATING
231st/ 347
METRIC RANK
3.14
AVERAGE FAMILY SIZE
0.3/ 100
METRIC RATING
285th/ 347
METRIC RANK
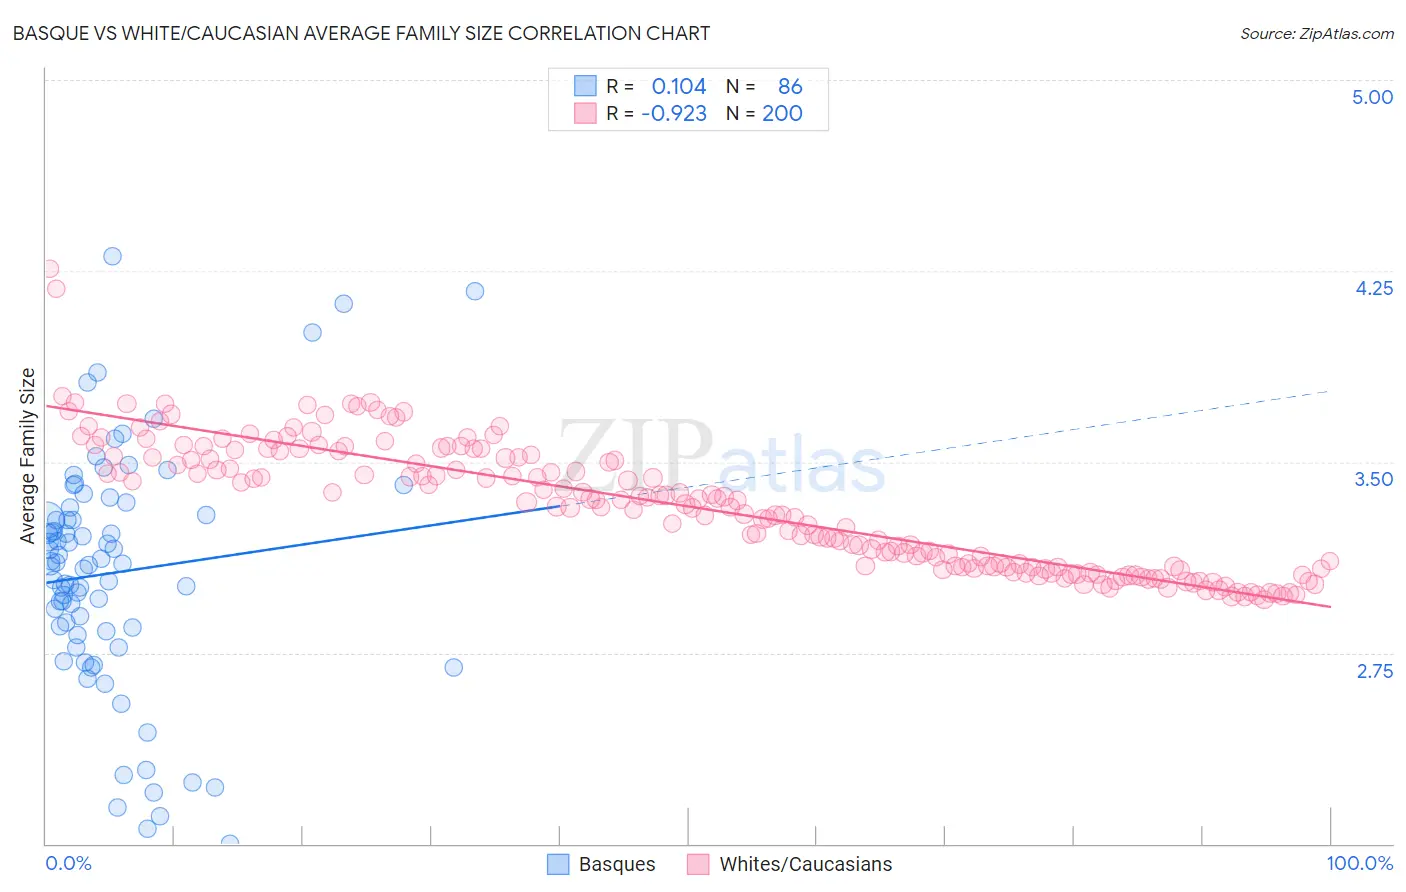
Basque vs White/Caucasian Average Family Size Correlation Chart
The statistical analysis conducted on geographies consisting of 165,752,068 people shows a poor positive correlation between the proportion of Basques and average family size in the United States with a correlation coefficient (R) of 0.104 and weighted average of 3.19. Similarly, the statistical analysis conducted on geographies consisting of 584,525,704 people shows a near-perfect negative correlation between the proportion of Whites/Caucasians and average family size in the United States with a correlation coefficient (R) of -0.923 and weighted average of 3.14, a difference of 1.3%.
Average Family Size Correlation Summary
| Measurement | Basque | White/Caucasian |
| Minimum | 2.00 | 2.96 |
| Maximum | 4.31 | 4.26 |
| Range | 2.31 | 1.30 |
| Mean | 3.06 | 3.32 |
| Median | 3.10 | 3.33 |
| Interquartile 25% (IQ1) | 2.83 | 3.09 |
| Interquartile 75% (IQ3) | 3.29 | 3.52 |
| Interquartile Range (IQR) | 0.46 | 0.43 |
| Standard Deviation (Sample) | 0.47 | 0.25 |
| Standard Deviation (Population) | 0.46 | 0.25 |
Similar Demographics by Average Family Size
Demographics Similar to Basques by Average Family Size
In terms of average family size, the demographic groups most similar to Basques are Icelander (3.19, a difference of 0.0%), Immigrants from Italy (3.19, a difference of 0.010%), Cherokee (3.18, a difference of 0.040%), Nonimmigrants (3.19, a difference of 0.050%), and Portuguese (3.19, a difference of 0.070%).
| Demographics | Rating | Rank | Average Family Size |
| Syrians | 6.5 /100 | #224 | Tragic 3.19 |
| Cree | 6.2 /100 | #225 | Tragic 3.19 |
| Chickasaw | 6.0 /100 | #226 | Tragic 3.19 |
| Portuguese | 6.0 /100 | #227 | Tragic 3.19 |
| Immigrants | Nonimmigrants | 5.7 /100 | #228 | Tragic 3.19 |
| Immigrants | Italy | 5.3 /100 | #229 | Tragic 3.19 |
| Icelanders | 5.2 /100 | #230 | Tragic 3.19 |
| Basques | 5.2 /100 | #231 | Tragic 3.19 |
| Cherokee | 4.7 /100 | #232 | Tragic 3.18 |
| Brazilians | 4.5 /100 | #233 | Tragic 3.18 |
| Iranians | 4.5 /100 | #234 | Tragic 3.18 |
| Immigrants | Turkey | 4.2 /100 | #235 | Tragic 3.18 |
| Immigrants | Portugal | 4.2 /100 | #236 | Tragic 3.18 |
| Immigrants | Romania | 3.7 /100 | #237 | Tragic 3.18 |
| Romanians | 3.7 /100 | #238 | Tragic 3.18 |
Demographics Similar to Whites/Caucasians by Average Family Size
In terms of average family size, the demographic groups most similar to Whites/Caucasians are Immigrants from France (3.15, a difference of 0.050%), Immigrants from Netherlands (3.14, a difference of 0.050%), Greek (3.14, a difference of 0.060%), Immigrants from Czechoslovakia (3.14, a difference of 0.060%), and Immigrants from Norway (3.14, a difference of 0.060%).
| Demographics | Rating | Rank | Average Family Size |
| Okinawans | 0.5 /100 | #278 | Tragic 3.15 |
| Immigrants | Europe | 0.5 /100 | #279 | Tragic 3.15 |
| Immigrants | England | 0.4 /100 | #280 | Tragic 3.15 |
| Immigrants | Denmark | 0.4 /100 | #281 | Tragic 3.15 |
| Yugoslavians | 0.4 /100 | #282 | Tragic 3.15 |
| German Russians | 0.4 /100 | #283 | Tragic 3.15 |
| Immigrants | France | 0.4 /100 | #284 | Tragic 3.15 |
| Whites/Caucasians | 0.3 /100 | #285 | Tragic 3.14 |
| Immigrants | Netherlands | 0.3 /100 | #286 | Tragic 3.14 |
| Greeks | 0.3 /100 | #287 | Tragic 3.14 |
| Immigrants | Czechoslovakia | 0.3 /100 | #288 | Tragic 3.14 |
| Immigrants | Norway | 0.3 /100 | #289 | Tragic 3.14 |
| Cypriots | 0.3 /100 | #290 | Tragic 3.14 |
| Alsatians | 0.2 /100 | #291 | Tragic 3.14 |
| Europeans | 0.2 /100 | #292 | Tragic 3.14 |