Basque vs Immigrants from Syria Average Family Size
COMPARE
Basque
Immigrants from Syria
Average Family Size
Average Family Size Comparison
Basques
Immigrants from Syria
3.19
AVERAGE FAMILY SIZE
5.2/ 100
METRIC RATING
231st/ 347
METRIC RANK
3.26
AVERAGE FAMILY SIZE
90.6/ 100
METRIC RATING
127th/ 347
METRIC RANK
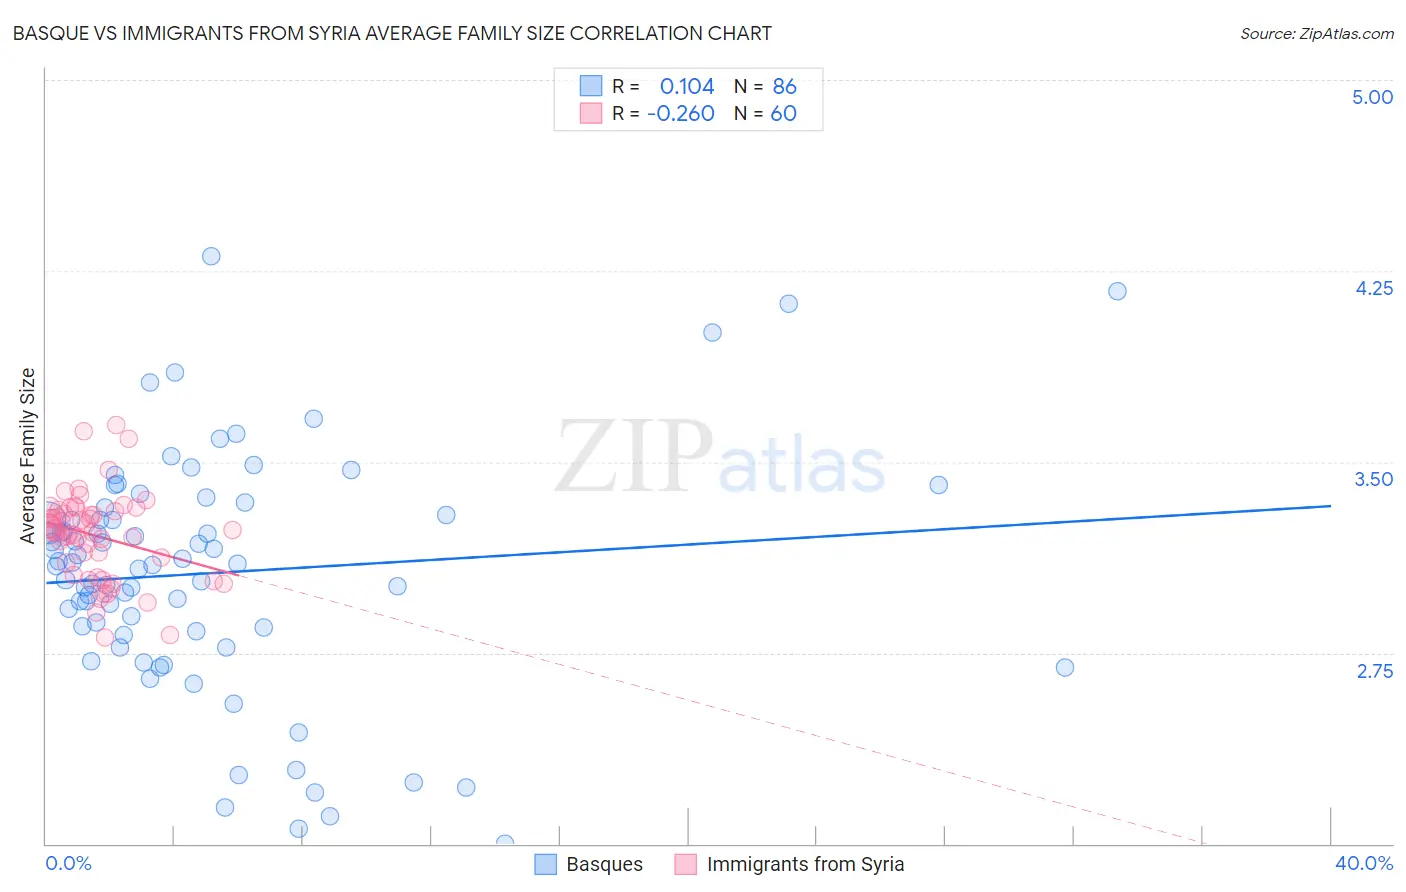
Basque vs Immigrants from Syria Average Family Size Correlation Chart
The statistical analysis conducted on geographies consisting of 165,752,068 people shows a poor positive correlation between the proportion of Basques and average family size in the United States with a correlation coefficient (R) of 0.104 and weighted average of 3.19. Similarly, the statistical analysis conducted on geographies consisting of 174,105,874 people shows a weak negative correlation between the proportion of Immigrants from Syria and average family size in the United States with a correlation coefficient (R) of -0.260 and weighted average of 3.26, a difference of 2.4%.
Average Family Size Correlation Summary
| Measurement | Basque | Immigrants from Syria |
| Minimum | 2.00 | 2.81 |
| Maximum | 4.31 | 3.64 |
| Range | 2.31 | 0.83 |
| Mean | 3.06 | 3.21 |
| Median | 3.10 | 3.23 |
| Interquartile 25% (IQ1) | 2.83 | 3.08 |
| Interquartile 75% (IQ3) | 3.29 | 3.31 |
| Interquartile Range (IQR) | 0.46 | 0.23 |
| Standard Deviation (Sample) | 0.47 | 0.17 |
| Standard Deviation (Population) | 0.46 | 0.17 |
Similar Demographics by Average Family Size
Demographics Similar to Basques by Average Family Size
In terms of average family size, the demographic groups most similar to Basques are Icelander (3.19, a difference of 0.0%), Immigrants from Italy (3.19, a difference of 0.010%), Cherokee (3.18, a difference of 0.040%), Nonimmigrants (3.19, a difference of 0.050%), and Portuguese (3.19, a difference of 0.070%).
| Demographics | Rating | Rank | Average Family Size |
| Syrians | 6.5 /100 | #224 | Tragic 3.19 |
| Cree | 6.2 /100 | #225 | Tragic 3.19 |
| Chickasaw | 6.0 /100 | #226 | Tragic 3.19 |
| Portuguese | 6.0 /100 | #227 | Tragic 3.19 |
| Immigrants | Nonimmigrants | 5.7 /100 | #228 | Tragic 3.19 |
| Immigrants | Italy | 5.3 /100 | #229 | Tragic 3.19 |
| Icelanders | 5.2 /100 | #230 | Tragic 3.19 |
| Basques | 5.2 /100 | #231 | Tragic 3.19 |
| Cherokee | 4.7 /100 | #232 | Tragic 3.18 |
| Brazilians | 4.5 /100 | #233 | Tragic 3.18 |
| Iranians | 4.5 /100 | #234 | Tragic 3.18 |
| Immigrants | Turkey | 4.2 /100 | #235 | Tragic 3.18 |
| Immigrants | Portugal | 4.2 /100 | #236 | Tragic 3.18 |
| Immigrants | Romania | 3.7 /100 | #237 | Tragic 3.18 |
| Romanians | 3.7 /100 | #238 | Tragic 3.18 |
Demographics Similar to Immigrants from Syria by Average Family Size
In terms of average family size, the demographic groups most similar to Immigrants from Syria are Immigrants from Costa Rica (3.26, a difference of 0.010%), Immigrants from Cuba (3.26, a difference of 0.040%), Colombian (3.26, a difference of 0.040%), South American Indian (3.26, a difference of 0.060%), and Immigrants from Hong Kong (3.26, a difference of 0.10%).
| Demographics | Rating | Rank | Average Family Size |
| Immigrants | Bahamas | 93.6 /100 | #120 | Exceptional 3.27 |
| Immigrants | Thailand | 93.3 /100 | #121 | Exceptional 3.27 |
| Immigrants | Colombia | 92.8 /100 | #122 | Exceptional 3.27 |
| Alaskan Athabascans | 92.4 /100 | #123 | Exceptional 3.27 |
| South American Indians | 91.6 /100 | #124 | Exceptional 3.26 |
| Immigrants | Cuba | 91.3 /100 | #125 | Exceptional 3.26 |
| Immigrants | Costa Rica | 90.7 /100 | #126 | Exceptional 3.26 |
| Immigrants | Syria | 90.6 /100 | #127 | Exceptional 3.26 |
| Colombians | 89.9 /100 | #128 | Excellent 3.26 |
| Immigrants | Hong Kong | 88.6 /100 | #129 | Excellent 3.26 |
| Laotians | 88.5 /100 | #130 | Excellent 3.26 |
| Immigrants | Western Asia | 87.7 /100 | #131 | Excellent 3.26 |
| Costa Ricans | 86.8 /100 | #132 | Excellent 3.26 |
| Immigrants | Venezuela | 86.3 /100 | #133 | Excellent 3.26 |
| Africans | 84.9 /100 | #134 | Excellent 3.25 |