Bangladeshi vs Central American Indian Family Households
COMPARE
Bangladeshi
Central American Indian
Family Households
Family Households Comparison
Bangladeshis
Central American Indians
64.3%
FAMILY HOUSEHOLDS
44.3/ 100
METRIC RATING
175th/ 347
METRIC RANK
65.2%
FAMILY HOUSEHOLDS
98.3/ 100
METRIC RATING
99th/ 347
METRIC RANK
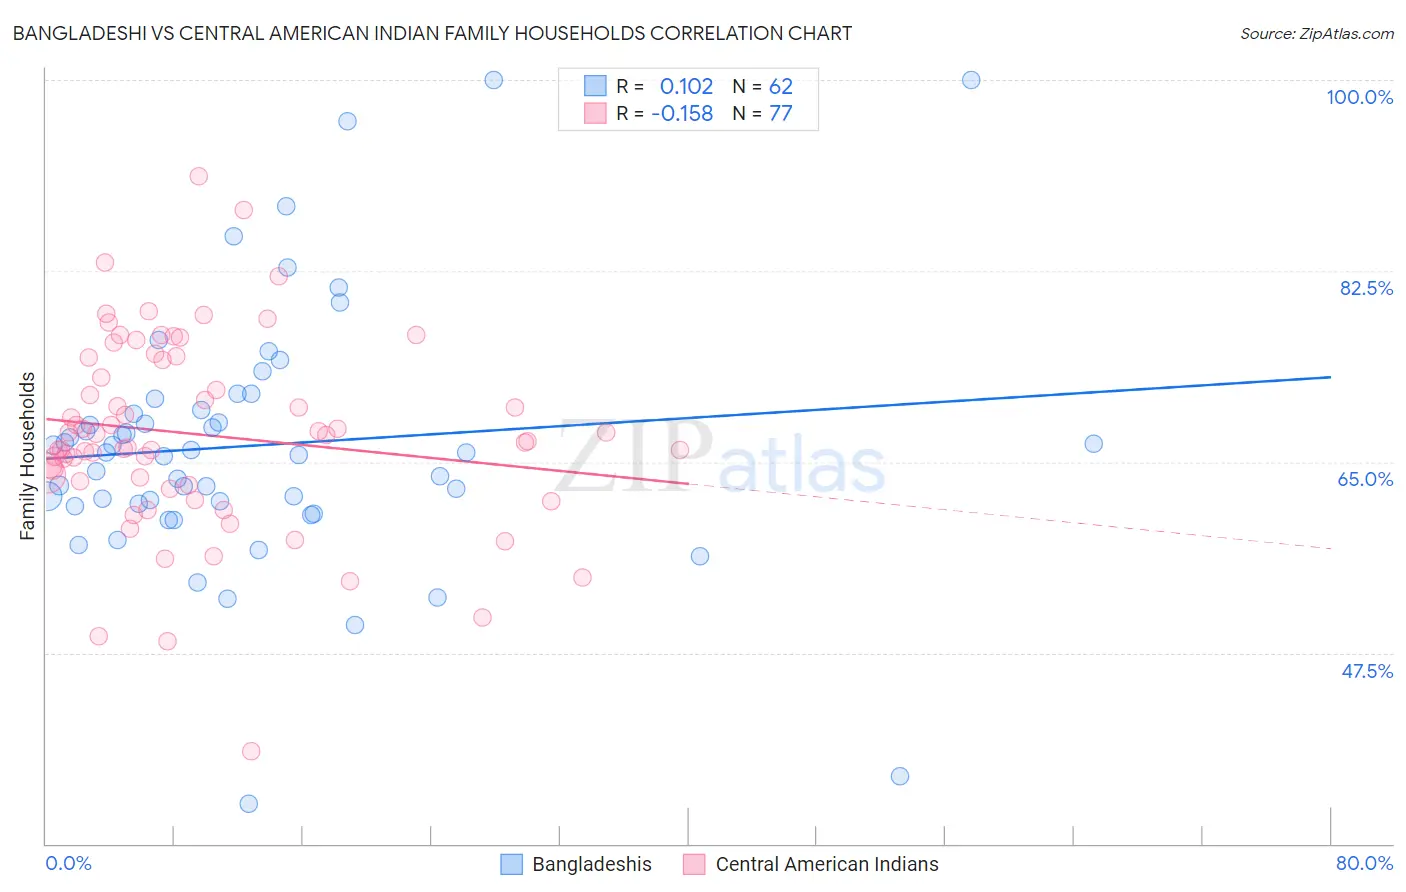
Bangladeshi vs Central American Indian Family Households Correlation Chart
The statistical analysis conducted on geographies consisting of 141,333,062 people shows a poor positive correlation between the proportion of Bangladeshis and percentage of family households in the United States with a correlation coefficient (R) of 0.102 and weighted average of 64.3%. Similarly, the statistical analysis conducted on geographies consisting of 326,061,567 people shows a poor negative correlation between the proportion of Central American Indians and percentage of family households in the United States with a correlation coefficient (R) of -0.158 and weighted average of 65.2%, a difference of 1.5%.
Family Households Correlation Summary
| Measurement | Bangladeshi | Central American Indian |
| Minimum | 33.7% | 38.5% |
| Maximum | 100.0% | 91.2% |
| Range | 66.3% | 52.8% |
| Mean | 66.5% | 67.5% |
| Median | 65.9% | 66.9% |
| Interquartile 25% (IQ1) | 61.1% | 63.1% |
| Interquartile 75% (IQ3) | 69.8% | 74.4% |
| Interquartile Range (IQR) | 8.7% | 11.3% |
| Standard Deviation (Sample) | 11.9% | 8.9% |
| Standard Deviation (Population) | 11.8% | 8.8% |
Similar Demographics by Family Households
Demographics Similar to Bangladeshis by Family Households
In terms of family households, the demographic groups most similar to Bangladeshis are Vietnamese (64.2%, a difference of 0.010%), Immigrants from Micronesia (64.2%, a difference of 0.030%), Jamaican (64.2%, a difference of 0.050%), Immigrants from Germany (64.3%, a difference of 0.080%), and Immigrants from Ukraine (64.2%, a difference of 0.080%).
| Demographics | Rating | Rank | Family Households |
| Hondurans | 57.5 /100 | #168 | Average 64.4% |
| Iraqis | 56.0 /100 | #169 | Average 64.4% |
| Armenians | 55.9 /100 | #170 | Average 64.4% |
| Ute | 54.6 /100 | #171 | Average 64.3% |
| Dutch West Indians | 53.9 /100 | #172 | Average 64.3% |
| Immigrants | Sierra Leone | 52.5 /100 | #173 | Average 64.3% |
| Immigrants | Germany | 50.0 /100 | #174 | Average 64.3% |
| Bangladeshis | 44.3 /100 | #175 | Average 64.3% |
| Vietnamese | 43.6 /100 | #176 | Average 64.2% |
| Immigrants | Micronesia | 42.3 /100 | #177 | Average 64.2% |
| Jamaicans | 40.6 /100 | #178 | Average 64.2% |
| Immigrants | Ukraine | 38.2 /100 | #179 | Fair 64.2% |
| Immigrants | Honduras | 35.0 /100 | #180 | Fair 64.2% |
| Immigrants | Trinidad and Tobago | 34.9 /100 | #181 | Fair 64.2% |
| Ukrainians | 34.6 /100 | #182 | Fair 64.2% |
Demographics Similar to Central American Indians by Family Households
In terms of family households, the demographic groups most similar to Central American Indians are Immigrants from Syria (65.2%, a difference of 0.020%), Haitian (65.2%, a difference of 0.040%), Chilean (65.2%, a difference of 0.040%), Swiss (65.2%, a difference of 0.060%), and Guatemalan (65.2%, a difference of 0.060%).
| Demographics | Rating | Rank | Family Households |
| Hopi | 98.8 /100 | #92 | Exceptional 65.3% |
| Guyanese | 98.8 /100 | #93 | Exceptional 65.3% |
| Immigrants | Poland | 98.7 /100 | #94 | Exceptional 65.2% |
| Immigrants | Portugal | 98.6 /100 | #95 | Exceptional 65.2% |
| Swiss | 98.6 /100 | #96 | Exceptional 65.2% |
| Guatemalans | 98.6 /100 | #97 | Exceptional 65.2% |
| Immigrants | Syria | 98.4 /100 | #98 | Exceptional 65.2% |
| Central American Indians | 98.3 /100 | #99 | Exceptional 65.2% |
| Haitians | 98.1 /100 | #100 | Exceptional 65.2% |
| Chileans | 98.1 /100 | #101 | Exceptional 65.2% |
| Immigrants | Sri Lanka | 98.0 /100 | #102 | Exceptional 65.1% |
| Indians (Asian) | 97.9 /100 | #103 | Exceptional 65.1% |
| Spaniards | 97.8 /100 | #104 | Exceptional 65.1% |
| English | 97.4 /100 | #105 | Exceptional 65.1% |
| Whites/Caucasians | 97.3 /100 | #106 | Exceptional 65.1% |