Immigrants from Thailand vs Central American Indian Family Households
COMPARE
Immigrants from Thailand
Central American Indian
Family Households
Family Households Comparison
Immigrants from Thailand
Central American Indians
63.8%
FAMILY HOUSEHOLDS
9.6/ 100
METRIC RATING
210th/ 347
METRIC RANK
65.2%
FAMILY HOUSEHOLDS
98.3/ 100
METRIC RATING
99th/ 347
METRIC RANK
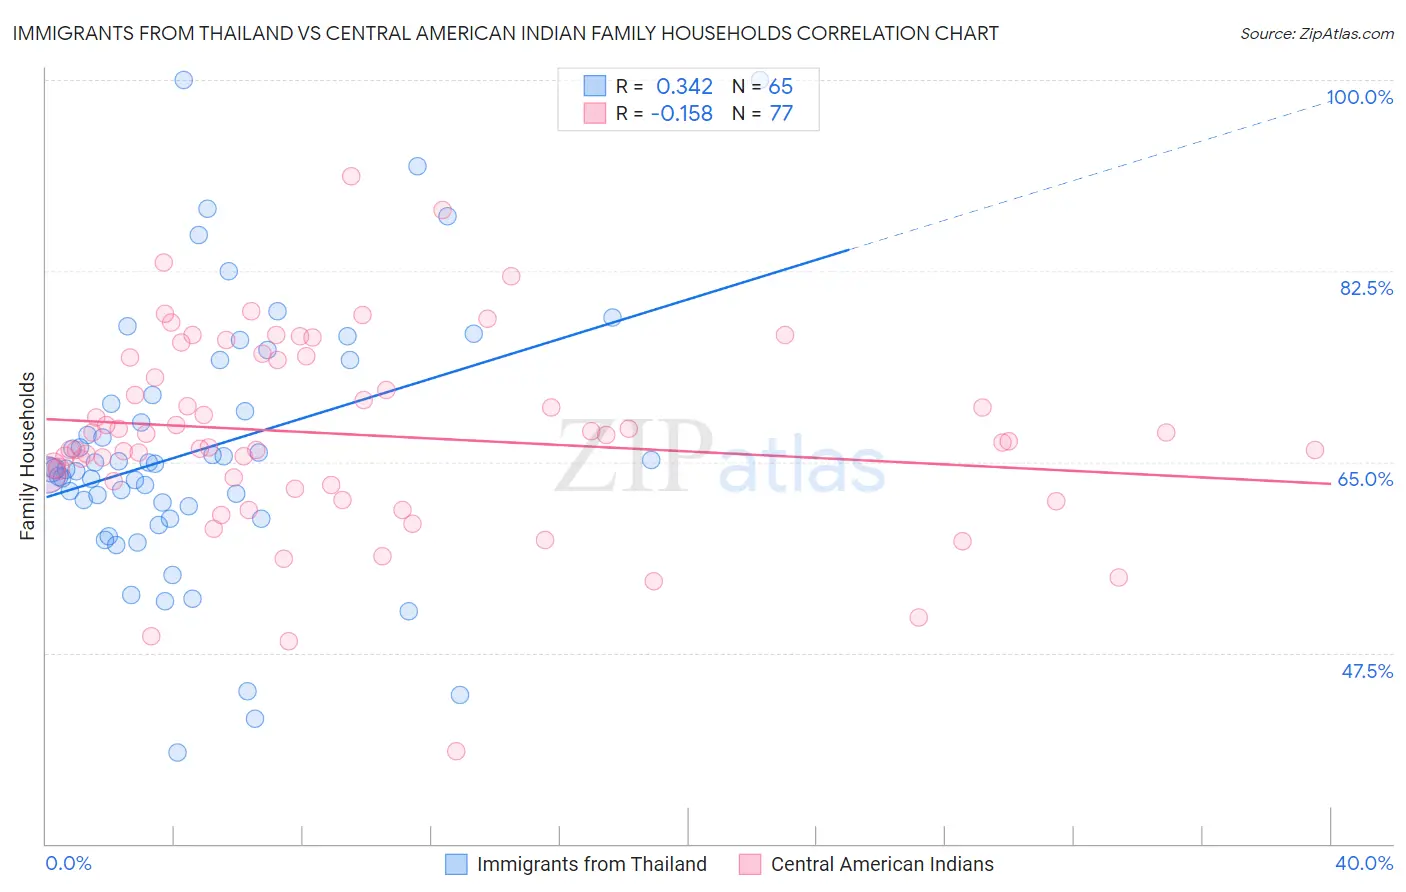
Immigrants from Thailand vs Central American Indian Family Households Correlation Chart
The statistical analysis conducted on geographies consisting of 316,927,069 people shows a mild positive correlation between the proportion of Immigrants from Thailand and percentage of family households in the United States with a correlation coefficient (R) of 0.342 and weighted average of 63.8%. Similarly, the statistical analysis conducted on geographies consisting of 326,061,567 people shows a poor negative correlation between the proportion of Central American Indians and percentage of family households in the United States with a correlation coefficient (R) of -0.158 and weighted average of 65.2%, a difference of 2.1%.
Family Households Correlation Summary
| Measurement | Immigrants from Thailand | Central American Indian |
| Minimum | 38.4% | 38.5% |
| Maximum | 100.0% | 91.2% |
| Range | 61.6% | 52.8% |
| Mean | 66.2% | 67.5% |
| Median | 64.4% | 66.9% |
| Interquartile 25% (IQ1) | 60.4% | 63.1% |
| Interquartile 75% (IQ3) | 72.7% | 74.4% |
| Interquartile Range (IQR) | 12.3% | 11.3% |
| Standard Deviation (Sample) | 12.2% | 8.9% |
| Standard Deviation (Population) | 12.1% | 8.8% |
Similar Demographics by Family Households
Demographics Similar to Immigrants from Thailand by Family Households
In terms of family households, the demographic groups most similar to Immigrants from Thailand are Shoshone (63.8%, a difference of 0.010%), Immigrants from Netherlands (63.8%, a difference of 0.010%), Immigrants from Northern Europe (63.8%, a difference of 0.030%), Immigrants from Bangladesh (63.9%, a difference of 0.060%), and Sierra Leonean (63.9%, a difference of 0.060%).
| Demographics | Rating | Rank | Family Households |
| Norwegians | 13.2 /100 | #203 | Poor 63.9% |
| Immigrants | Uruguay | 12.8 /100 | #204 | Poor 63.9% |
| Brazilians | 12.4 /100 | #205 | Poor 63.9% |
| Immigrants | Lithuania | 12.1 /100 | #206 | Poor 63.9% |
| Nigerians | 11.5 /100 | #207 | Poor 63.9% |
| Immigrants | Bangladesh | 11.4 /100 | #208 | Poor 63.9% |
| Sierra Leoneans | 11.2 /100 | #209 | Poor 63.9% |
| Immigrants | Thailand | 9.6 /100 | #210 | Tragic 63.8% |
| Shoshone | 9.4 /100 | #211 | Tragic 63.8% |
| Immigrants | Netherlands | 9.4 /100 | #212 | Tragic 63.8% |
| Immigrants | Northern Europe | 8.8 /100 | #213 | Tragic 63.8% |
| Celtics | 8.0 /100 | #214 | Tragic 63.8% |
| Belgians | 7.6 /100 | #215 | Tragic 63.8% |
| Croatians | 7.3 /100 | #216 | Tragic 63.8% |
| Osage | 7.0 /100 | #217 | Tragic 63.7% |
Demographics Similar to Central American Indians by Family Households
In terms of family households, the demographic groups most similar to Central American Indians are Immigrants from Syria (65.2%, a difference of 0.020%), Haitian (65.2%, a difference of 0.040%), Chilean (65.2%, a difference of 0.040%), Swiss (65.2%, a difference of 0.060%), and Guatemalan (65.2%, a difference of 0.060%).
| Demographics | Rating | Rank | Family Households |
| Hopi | 98.8 /100 | #92 | Exceptional 65.3% |
| Guyanese | 98.8 /100 | #93 | Exceptional 65.3% |
| Immigrants | Poland | 98.7 /100 | #94 | Exceptional 65.2% |
| Immigrants | Portugal | 98.6 /100 | #95 | Exceptional 65.2% |
| Swiss | 98.6 /100 | #96 | Exceptional 65.2% |
| Guatemalans | 98.6 /100 | #97 | Exceptional 65.2% |
| Immigrants | Syria | 98.4 /100 | #98 | Exceptional 65.2% |
| Central American Indians | 98.3 /100 | #99 | Exceptional 65.2% |
| Haitians | 98.1 /100 | #100 | Exceptional 65.2% |
| Chileans | 98.1 /100 | #101 | Exceptional 65.2% |
| Immigrants | Sri Lanka | 98.0 /100 | #102 | Exceptional 65.1% |
| Indians (Asian) | 97.9 /100 | #103 | Exceptional 65.1% |
| Spaniards | 97.8 /100 | #104 | Exceptional 65.1% |
| English | 97.4 /100 | #105 | Exceptional 65.1% |
| Whites/Caucasians | 97.3 /100 | #106 | Exceptional 65.1% |