Bangladeshi vs Immigrants from Denmark Family Households
COMPARE
Bangladeshi
Immigrants from Denmark
Family Households
Family Households Comparison
Bangladeshis
Immigrants from Denmark
64.3%
FAMILY HOUSEHOLDS
44.3/ 100
METRIC RATING
175th/ 347
METRIC RANK
62.9%
FAMILY HOUSEHOLDS
0.1/ 100
METRIC RATING
283rd/ 347
METRIC RANK
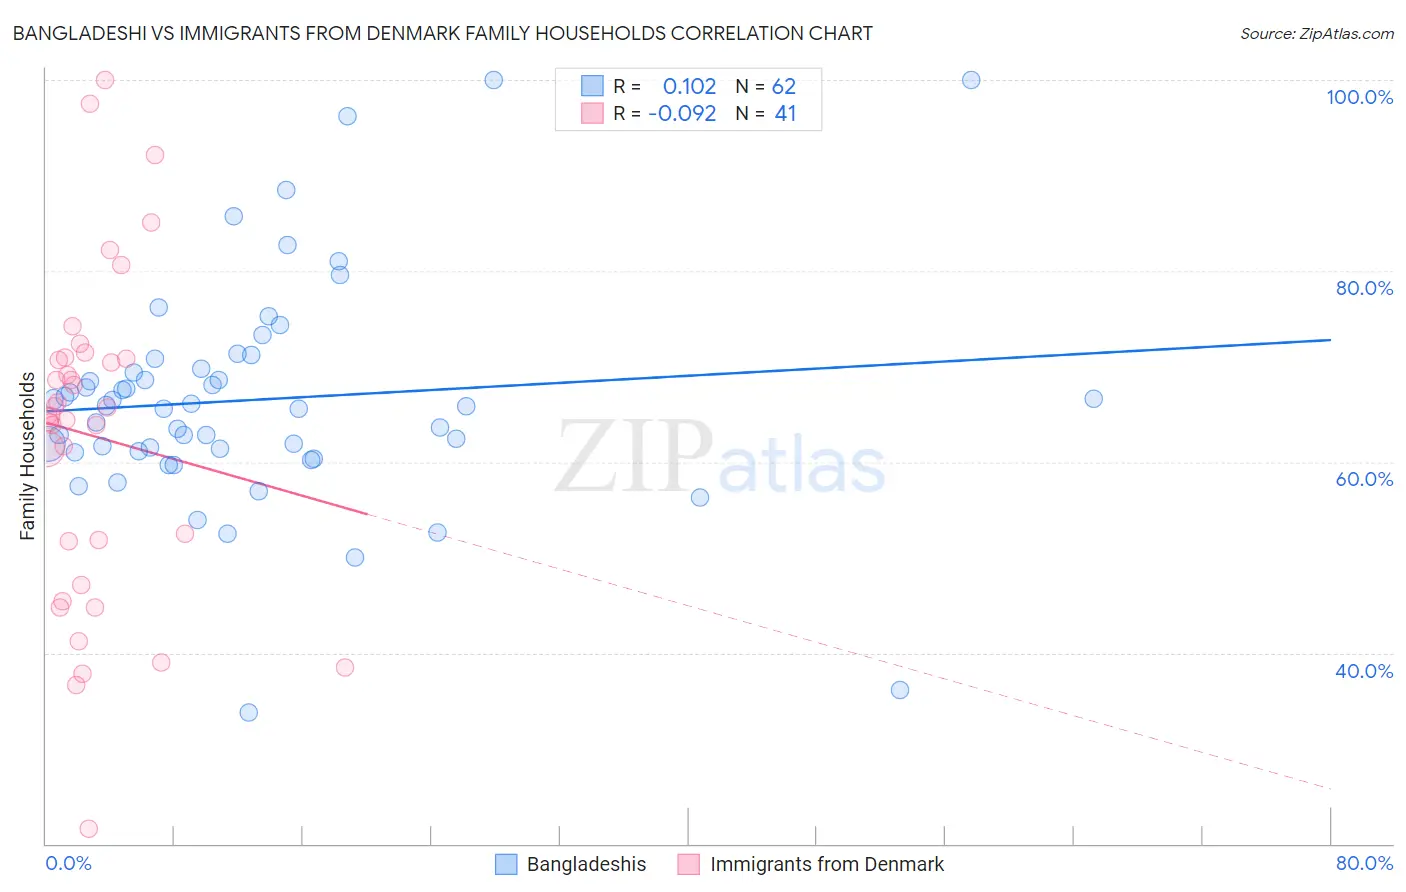
Bangladeshi vs Immigrants from Denmark Family Households Correlation Chart
The statistical analysis conducted on geographies consisting of 141,333,062 people shows a poor positive correlation between the proportion of Bangladeshis and percentage of family households in the United States with a correlation coefficient (R) of 0.102 and weighted average of 64.3%. Similarly, the statistical analysis conducted on geographies consisting of 136,405,039 people shows a slight negative correlation between the proportion of Immigrants from Denmark and percentage of family households in the United States with a correlation coefficient (R) of -0.092 and weighted average of 62.9%, a difference of 2.2%.
Family Households Correlation Summary
| Measurement | Bangladeshi | Immigrants from Denmark |
| Minimum | 33.7% | 21.6% |
| Maximum | 100.0% | 100.0% |
| Range | 66.3% | 78.4% |
| Mean | 66.5% | 62.7% |
| Median | 65.9% | 64.8% |
| Interquartile 25% (IQ1) | 61.1% | 49.4% |
| Interquartile 75% (IQ3) | 69.8% | 70.9% |
| Interquartile Range (IQR) | 8.7% | 21.5% |
| Standard Deviation (Sample) | 11.9% | 17.0% |
| Standard Deviation (Population) | 11.8% | 16.8% |
Similar Demographics by Family Households
Demographics Similar to Bangladeshis by Family Households
In terms of family households, the demographic groups most similar to Bangladeshis are Vietnamese (64.2%, a difference of 0.010%), Immigrants from Micronesia (64.2%, a difference of 0.030%), Jamaican (64.2%, a difference of 0.050%), Immigrants from Germany (64.3%, a difference of 0.080%), and Immigrants from Ukraine (64.2%, a difference of 0.080%).
| Demographics | Rating | Rank | Family Households |
| Hondurans | 57.5 /100 | #168 | Average 64.4% |
| Iraqis | 56.0 /100 | #169 | Average 64.4% |
| Armenians | 55.9 /100 | #170 | Average 64.4% |
| Ute | 54.6 /100 | #171 | Average 64.3% |
| Dutch West Indians | 53.9 /100 | #172 | Average 64.3% |
| Immigrants | Sierra Leone | 52.5 /100 | #173 | Average 64.3% |
| Immigrants | Germany | 50.0 /100 | #174 | Average 64.3% |
| Bangladeshis | 44.3 /100 | #175 | Average 64.3% |
| Vietnamese | 43.6 /100 | #176 | Average 64.2% |
| Immigrants | Micronesia | 42.3 /100 | #177 | Average 64.2% |
| Jamaicans | 40.6 /100 | #178 | Average 64.2% |
| Immigrants | Ukraine | 38.2 /100 | #179 | Fair 64.2% |
| Immigrants | Honduras | 35.0 /100 | #180 | Fair 64.2% |
| Immigrants | Trinidad and Tobago | 34.9 /100 | #181 | Fair 64.2% |
| Ukrainians | 34.6 /100 | #182 | Fair 64.2% |
Demographics Similar to Immigrants from Denmark by Family Households
In terms of family households, the demographic groups most similar to Immigrants from Denmark are New Zealander (62.9%, a difference of 0.010%), Estonian (62.9%, a difference of 0.040%), Australian (62.8%, a difference of 0.040%), Immigrants from Bulgaria (63.0%, a difference of 0.13%), and Immigrants from Yemen (63.0%, a difference of 0.15%).
| Demographics | Rating | Rank | Family Households |
| Serbians | 0.3 /100 | #276 | Tragic 63.0% |
| Ottawa | 0.3 /100 | #277 | Tragic 63.0% |
| Immigrants | Belgium | 0.2 /100 | #278 | Tragic 63.0% |
| Immigrants | Yemen | 0.2 /100 | #279 | Tragic 63.0% |
| Immigrants | Bulgaria | 0.2 /100 | #280 | Tragic 63.0% |
| Estonians | 0.2 /100 | #281 | Tragic 62.9% |
| New Zealanders | 0.1 /100 | #282 | Tragic 62.9% |
| Immigrants | Denmark | 0.1 /100 | #283 | Tragic 62.9% |
| Australians | 0.1 /100 | #284 | Tragic 62.8% |
| Mongolians | 0.1 /100 | #285 | Tragic 62.8% |
| British West Indians | 0.1 /100 | #286 | Tragic 62.8% |
| Latvians | 0.1 /100 | #287 | Tragic 62.8% |
| Immigrants | Uganda | 0.1 /100 | #288 | Tragic 62.7% |
| Immigrants | Nepal | 0.1 /100 | #289 | Tragic 62.7% |
| Immigrants | Grenada | 0.0 /100 | #290 | Tragic 62.6% |