Bangladeshi vs Colombian Family Households
COMPARE
Bangladeshi
Colombian
Family Households
Family Households Comparison
Bangladeshis
Colombians
64.3%
FAMILY HOUSEHOLDS
44.3/ 100
METRIC RATING
175th/ 347
METRIC RANK
66.3%
FAMILY HOUSEHOLDS
100.0/ 100
METRIC RATING
52nd/ 347
METRIC RANK
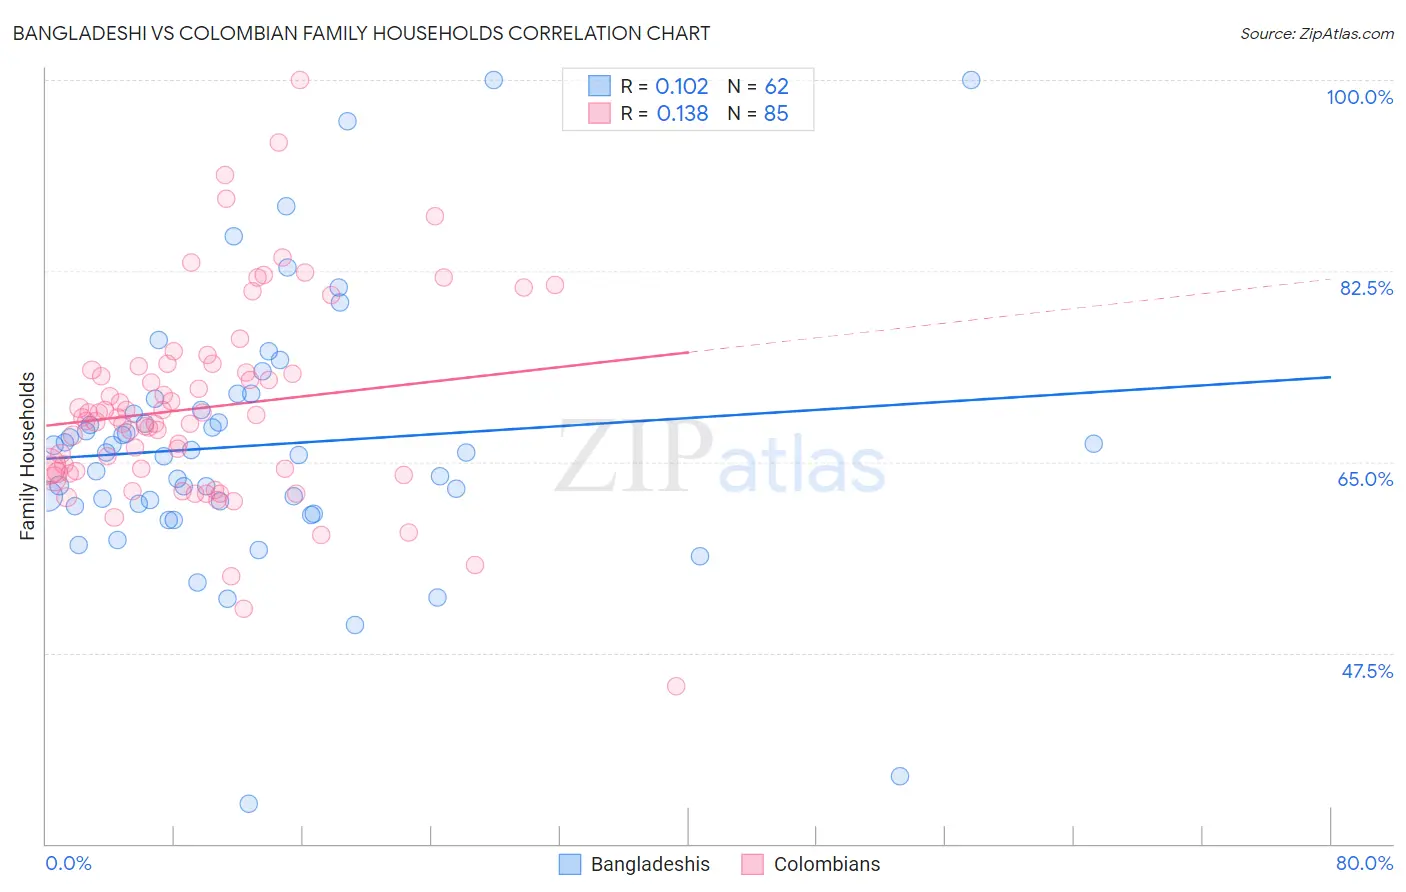
Bangladeshi vs Colombian Family Households Correlation Chart
The statistical analysis conducted on geographies consisting of 141,333,062 people shows a poor positive correlation between the proportion of Bangladeshis and percentage of family households in the United States with a correlation coefficient (R) of 0.102 and weighted average of 64.3%. Similarly, the statistical analysis conducted on geographies consisting of 419,324,434 people shows a poor positive correlation between the proportion of Colombians and percentage of family households in the United States with a correlation coefficient (R) of 0.138 and weighted average of 66.3%, a difference of 3.1%.
Family Households Correlation Summary
| Measurement | Bangladeshi | Colombian |
| Minimum | 33.7% | 44.4% |
| Maximum | 100.0% | 100.0% |
| Range | 66.3% | 55.6% |
| Mean | 66.5% | 70.0% |
| Median | 65.9% | 69.1% |
| Interquartile 25% (IQ1) | 61.1% | 64.1% |
| Interquartile 75% (IQ3) | 69.8% | 73.6% |
| Interquartile Range (IQR) | 8.7% | 9.5% |
| Standard Deviation (Sample) | 11.9% | 9.2% |
| Standard Deviation (Population) | 11.8% | 9.2% |
Similar Demographics by Family Households
Demographics Similar to Bangladeshis by Family Households
In terms of family households, the demographic groups most similar to Bangladeshis are Vietnamese (64.2%, a difference of 0.010%), Immigrants from Micronesia (64.2%, a difference of 0.030%), Jamaican (64.2%, a difference of 0.050%), Immigrants from Germany (64.3%, a difference of 0.080%), and Immigrants from Ukraine (64.2%, a difference of 0.080%).
| Demographics | Rating | Rank | Family Households |
| Hondurans | 57.5 /100 | #168 | Average 64.4% |
| Iraqis | 56.0 /100 | #169 | Average 64.4% |
| Armenians | 55.9 /100 | #170 | Average 64.4% |
| Ute | 54.6 /100 | #171 | Average 64.3% |
| Dutch West Indians | 53.9 /100 | #172 | Average 64.3% |
| Immigrants | Sierra Leone | 52.5 /100 | #173 | Average 64.3% |
| Immigrants | Germany | 50.0 /100 | #174 | Average 64.3% |
| Bangladeshis | 44.3 /100 | #175 | Average 64.3% |
| Vietnamese | 43.6 /100 | #176 | Average 64.2% |
| Immigrants | Micronesia | 42.3 /100 | #177 | Average 64.2% |
| Jamaicans | 40.6 /100 | #178 | Average 64.2% |
| Immigrants | Ukraine | 38.2 /100 | #179 | Fair 64.2% |
| Immigrants | Honduras | 35.0 /100 | #180 | Fair 64.2% |
| Immigrants | Trinidad and Tobago | 34.9 /100 | #181 | Fair 64.2% |
| Ukrainians | 34.6 /100 | #182 | Fair 64.2% |
Demographics Similar to Colombians by Family Households
In terms of family households, the demographic groups most similar to Colombians are Afghan (66.3%, a difference of 0.010%), Immigrants from Colombia (66.3%, a difference of 0.010%), Native/Alaskan (66.4%, a difference of 0.14%), Navajo (66.4%, a difference of 0.16%), and Immigrants (66.1%, a difference of 0.17%).
| Demographics | Rating | Rank | Family Households |
| Venezuelans | 100.0 /100 | #45 | Exceptional 66.5% |
| Arapaho | 100.0 /100 | #46 | Exceptional 66.5% |
| Bolivians | 100.0 /100 | #47 | Exceptional 66.5% |
| Immigrants | Venezuela | 100.0 /100 | #48 | Exceptional 66.4% |
| Immigrants | South Central Asia | 100.0 /100 | #49 | Exceptional 66.4% |
| Navajo | 100.0 /100 | #50 | Exceptional 66.4% |
| Natives/Alaskans | 100.0 /100 | #51 | Exceptional 66.4% |
| Colombians | 100.0 /100 | #52 | Exceptional 66.3% |
| Afghans | 100.0 /100 | #53 | Exceptional 66.3% |
| Immigrants | Colombia | 100.0 /100 | #54 | Exceptional 66.3% |
| Immigrants | Immigrants | 100.0 /100 | #55 | Exceptional 66.1% |
| Immigrants | Hong Kong | 100.0 /100 | #56 | Exceptional 66.1% |
| Pennsylvania Germans | 100.0 /100 | #57 | Exceptional 66.1% |
| Immigrants | Asia | 100.0 /100 | #58 | Exceptional 66.1% |
| Immigrants | Korea | 100.0 /100 | #59 | Exceptional 66.0% |