Bahamian vs Asian 3rd Grade
COMPARE
Bahamian
Asian
3rd Grade
3rd Grade Comparison
Bahamians
Asians
97.5%
3RD GRADE
4.4/ 100
METRIC RATING
224th/ 347
METRIC RANK
97.4%
3RD GRADE
1.1/ 100
METRIC RATING
244th/ 347
METRIC RANK
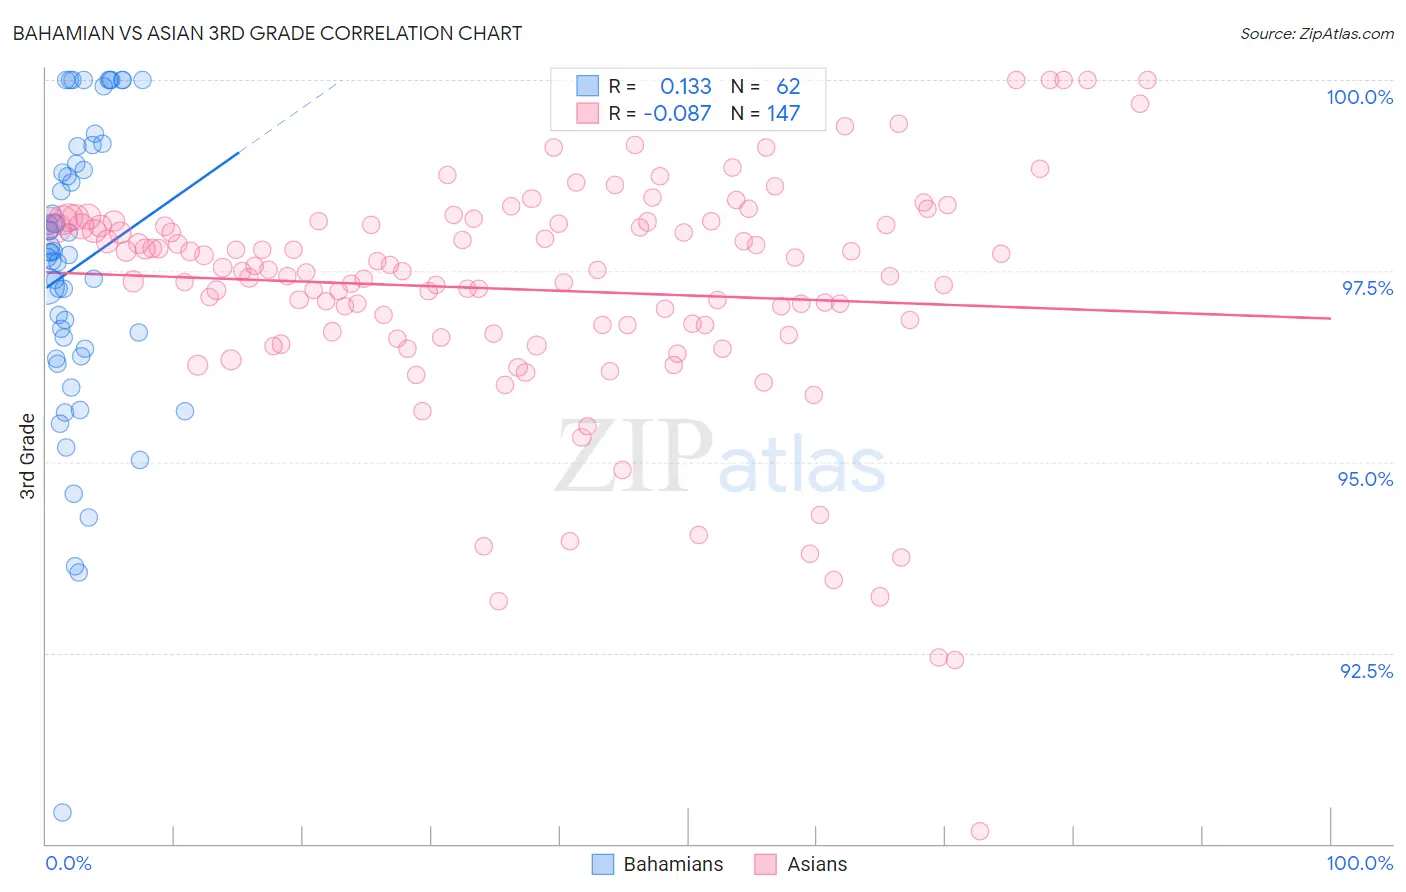
Bahamian vs Asian 3rd Grade Correlation Chart
The statistical analysis conducted on geographies consisting of 112,697,105 people shows a poor positive correlation between the proportion of Bahamians and percentage of population with at least 3rd grade education in the United States with a correlation coefficient (R) of 0.133 and weighted average of 97.5%. Similarly, the statistical analysis conducted on geographies consisting of 550,801,467 people shows a slight negative correlation between the proportion of Asians and percentage of population with at least 3rd grade education in the United States with a correlation coefficient (R) of -0.087 and weighted average of 97.4%, a difference of 0.12%.
3rd Grade Correlation Summary
| Measurement | Bahamian | Asian |
| Minimum | 90.4% | 90.2% |
| Maximum | 100.0% | 100.0% |
| Range | 9.6% | 9.8% |
| Mean | 97.6% | 97.3% |
| Median | 97.7% | 97.5% |
| Interquartile 25% (IQ1) | 96.5% | 96.7% |
| Interquartile 75% (IQ3) | 98.9% | 98.1% |
| Interquartile Range (IQR) | 2.4% | 1.4% |
| Standard Deviation (Sample) | 1.9% | 1.6% |
| Standard Deviation (Population) | 1.9% | 1.6% |
Demographics Similar to Bahamians and Asians by 3rd Grade
In terms of 3rd grade, the demographic groups most similar to Bahamians are Tongan (97.5%, a difference of 0.0%), Sudanese (97.5%, a difference of 0.010%), Immigrants from Sudan (97.5%, a difference of 0.020%), Subsaharan African (97.5%, a difference of 0.030%), and Senegalese (97.5%, a difference of 0.030%). Similarly, the demographic groups most similar to Asians are Korean (97.4%, a difference of 0.010%), Indian (Asian) (97.4%, a difference of 0.010%), U.S. Virgin Islander (97.4%, a difference of 0.020%), Immigrants from Indonesia (97.4%, a difference of 0.020%), and Immigrants from Uruguay (97.4%, a difference of 0.030%).
| Demographics | Rating | Rank | 3rd Grade |
| Bahamians | 4.4 /100 | #224 | Tragic 97.5% |
| Tongans | 4.3 /100 | #225 | Tragic 97.5% |
| Sudanese | 4.1 /100 | #226 | Tragic 97.5% |
| Immigrants | Sudan | 3.4 /100 | #227 | Tragic 97.5% |
| Sub-Saharan Africans | 3.2 /100 | #228 | Tragic 97.5% |
| Senegalese | 3.0 /100 | #229 | Tragic 97.5% |
| Immigrants | Pakistan | 2.7 /100 | #230 | Tragic 97.5% |
| Immigrants | Costa Rica | 2.7 /100 | #231 | Tragic 97.5% |
| Immigrants | Western Asia | 2.6 /100 | #232 | Tragic 97.5% |
| Immigrants | Malaysia | 2.4 /100 | #233 | Tragic 97.5% |
| Immigrants | Eastern Asia | 1.9 /100 | #234 | Tragic 97.4% |
| Immigrants | Iraq | 1.8 /100 | #235 | Tragic 97.4% |
| Liberians | 1.8 /100 | #236 | Tragic 97.4% |
| Colombians | 1.8 /100 | #237 | Tragic 97.4% |
| Immigrants | Uruguay | 1.7 /100 | #238 | Tragic 97.4% |
| Nigerians | 1.6 /100 | #239 | Tragic 97.4% |
| U.S. Virgin Islanders | 1.4 /100 | #240 | Tragic 97.4% |
| Immigrants | Indonesia | 1.4 /100 | #241 | Tragic 97.4% |
| Koreans | 1.3 /100 | #242 | Tragic 97.4% |
| Indians (Asian) | 1.3 /100 | #243 | Tragic 97.4% |
| Asians | 1.1 /100 | #244 | Tragic 97.4% |