Assyrian/Chaldean/Syriac vs Immigrants from Eastern Asia Master's Degree
COMPARE
Assyrian/Chaldean/Syriac
Immigrants from Eastern Asia
Master's Degree
Master's Degree Comparison
Assyrians/Chaldeans/Syriacs
Immigrants from Eastern Asia
15.8%
MASTER'S DEGREE
86.8/ 100
METRIC RATING
136th/ 347
METRIC RANK
20.8%
MASTER'S DEGREE
100.0/ 100
METRIC RATING
15th/ 347
METRIC RANK
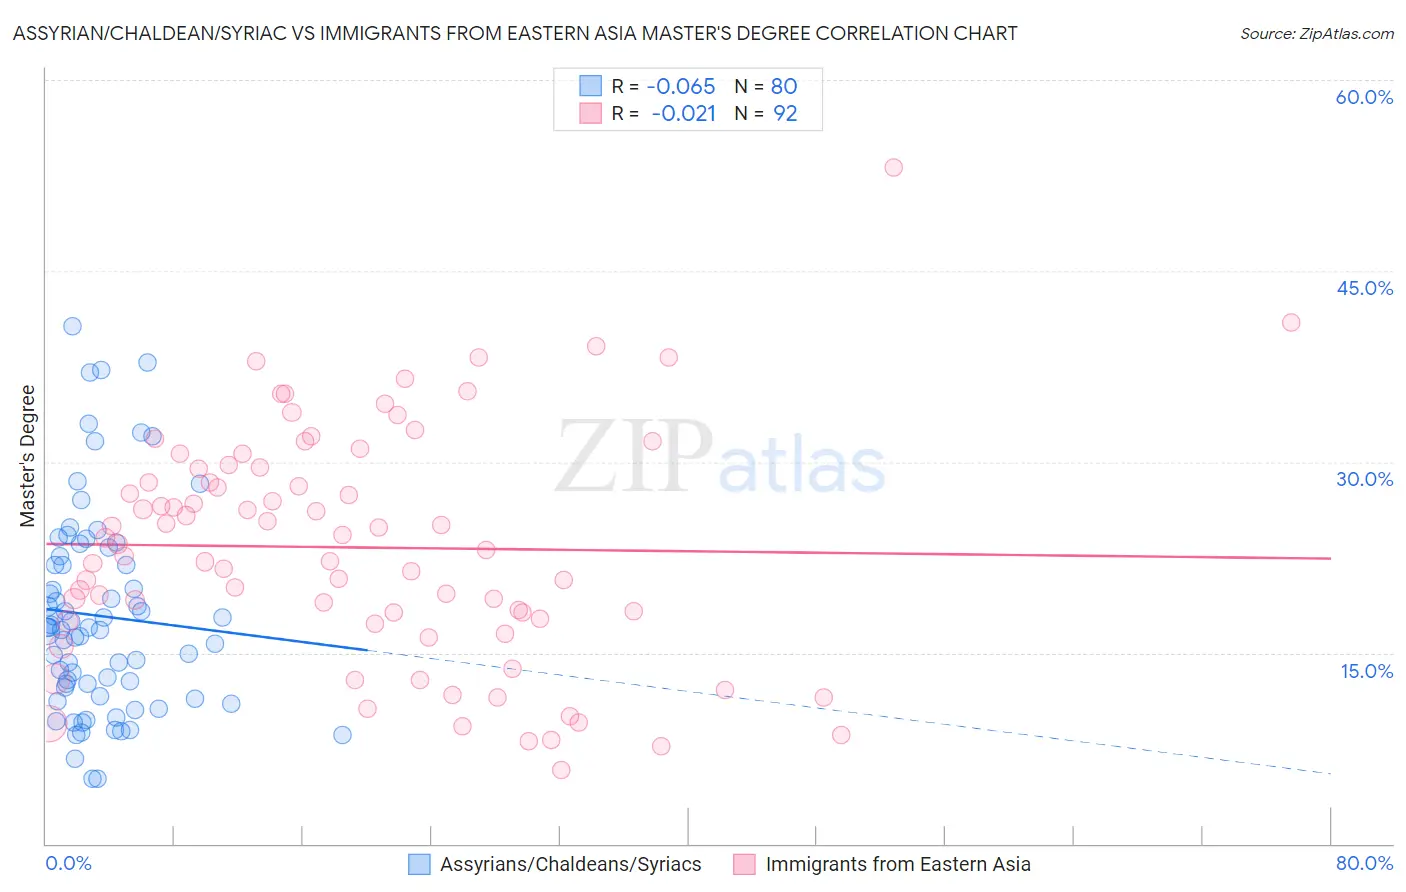
Assyrian/Chaldean/Syriac vs Immigrants from Eastern Asia Master's Degree Correlation Chart
The statistical analysis conducted on geographies consisting of 110,306,955 people shows a slight negative correlation between the proportion of Assyrians/Chaldeans/Syriacs and percentage of population with at least master's degree education in the United States with a correlation coefficient (R) of -0.065 and weighted average of 15.8%. Similarly, the statistical analysis conducted on geographies consisting of 499,625,915 people shows no correlation between the proportion of Immigrants from Eastern Asia and percentage of population with at least master's degree education in the United States with a correlation coefficient (R) of -0.021 and weighted average of 20.8%, a difference of 31.7%.
Master's Degree Correlation Summary
| Measurement | Assyrian/Chaldean/Syriac | Immigrants from Eastern Asia |
| Minimum | 5.1% | 5.8% |
| Maximum | 40.6% | 53.1% |
| Range | 35.6% | 47.3% |
| Mean | 17.9% | 23.3% |
| Median | 16.9% | 23.3% |
| Interquartile 25% (IQ1) | 11.9% | 17.6% |
| Interquartile 75% (IQ3) | 22.3% | 29.5% |
| Interquartile Range (IQR) | 10.3% | 11.9% |
| Standard Deviation (Sample) | 8.0% | 9.1% |
| Standard Deviation (Population) | 7.9% | 9.1% |
Similar Demographics by Master's Degree
Demographics Similar to Assyrians/Chaldeans/Syriacs by Master's Degree
In terms of master's degree, the demographic groups most similar to Assyrians/Chaldeans/Syriacs are European (15.8%, a difference of 0.10%), Pakistani (15.8%, a difference of 0.18%), Immigrants from Germany (15.8%, a difference of 0.24%), Vietnamese (15.8%, a difference of 0.33%), and Venezuelan (15.9%, a difference of 0.45%).
| Demographics | Rating | Rank | Master's Degree |
| Immigrants | Syria | 93.3 /100 | #129 | Exceptional 16.2% |
| Immigrants | Jordan | 92.7 /100 | #130 | Exceptional 16.1% |
| Taiwanese | 91.9 /100 | #131 | Exceptional 16.1% |
| Serbians | 91.7 /100 | #132 | Exceptional 16.1% |
| Immigrants | Sudan | 90.2 /100 | #133 | Exceptional 16.0% |
| Venezuelans | 88.4 /100 | #134 | Excellent 15.9% |
| South American Indians | 88.4 /100 | #135 | Excellent 15.9% |
| Assyrians/Chaldeans/Syriacs | 86.8 /100 | #136 | Excellent 15.8% |
| Europeans | 86.4 /100 | #137 | Excellent 15.8% |
| Pakistanis | 86.1 /100 | #138 | Excellent 15.8% |
| Immigrants | Germany | 85.9 /100 | #139 | Excellent 15.8% |
| Vietnamese | 85.5 /100 | #140 | Excellent 15.8% |
| Poles | 85.0 /100 | #141 | Excellent 15.7% |
| Immigrants | Africa | 84.0 /100 | #142 | Excellent 15.7% |
| Immigrants | Venezuela | 83.6 /100 | #143 | Excellent 15.7% |
Demographics Similar to Immigrants from Eastern Asia by Master's Degree
In terms of master's degree, the demographic groups most similar to Immigrants from Eastern Asia are Immigrants from Switzerland (20.9%, a difference of 0.18%), Immigrants from Australia (20.9%, a difference of 0.19%), Immigrants from Belgium (20.8%, a difference of 0.29%), Immigrants from South Central Asia (20.7%, a difference of 0.54%), and Eastern European (21.1%, a difference of 1.4%).
| Demographics | Rating | Rank | Master's Degree |
| Cypriots | 100.0 /100 | #8 | Exceptional 21.8% |
| Thais | 100.0 /100 | #9 | Exceptional 21.7% |
| Immigrants | Iran | 100.0 /100 | #10 | Exceptional 21.6% |
| Immigrants | China | 100.0 /100 | #11 | Exceptional 21.2% |
| Eastern Europeans | 100.0 /100 | #12 | Exceptional 21.1% |
| Immigrants | Australia | 100.0 /100 | #13 | Exceptional 20.9% |
| Immigrants | Switzerland | 100.0 /100 | #14 | Exceptional 20.9% |
| Immigrants | Eastern Asia | 100.0 /100 | #15 | Exceptional 20.8% |
| Immigrants | Belgium | 100.0 /100 | #16 | Exceptional 20.8% |
| Immigrants | South Central Asia | 100.0 /100 | #17 | Exceptional 20.7% |
| Soviet Union | 100.0 /100 | #18 | Exceptional 20.5% |
| Immigrants | Hong Kong | 100.0 /100 | #19 | Exceptional 20.5% |
| Indians (Asian) | 100.0 /100 | #20 | Exceptional 20.5% |
| Immigrants | Ireland | 100.0 /100 | #21 | Exceptional 20.4% |
| Israelis | 100.0 /100 | #22 | Exceptional 20.3% |