Armenian vs Immigrants from Russia Births to Unmarried Women
COMPARE
Armenian
Immigrants from Russia
Births to Unmarried Women
Births to Unmarried Women Comparison
Armenians
Immigrants from Russia
26.2%
BIRTHS TO UNMARRIED WOMEN
99.9/ 100
METRIC RATING
19th/ 347
METRIC RANK
27.1%
BIRTHS TO UNMARRIED WOMEN
99.8/ 100
METRIC RATING
32nd/ 347
METRIC RANK
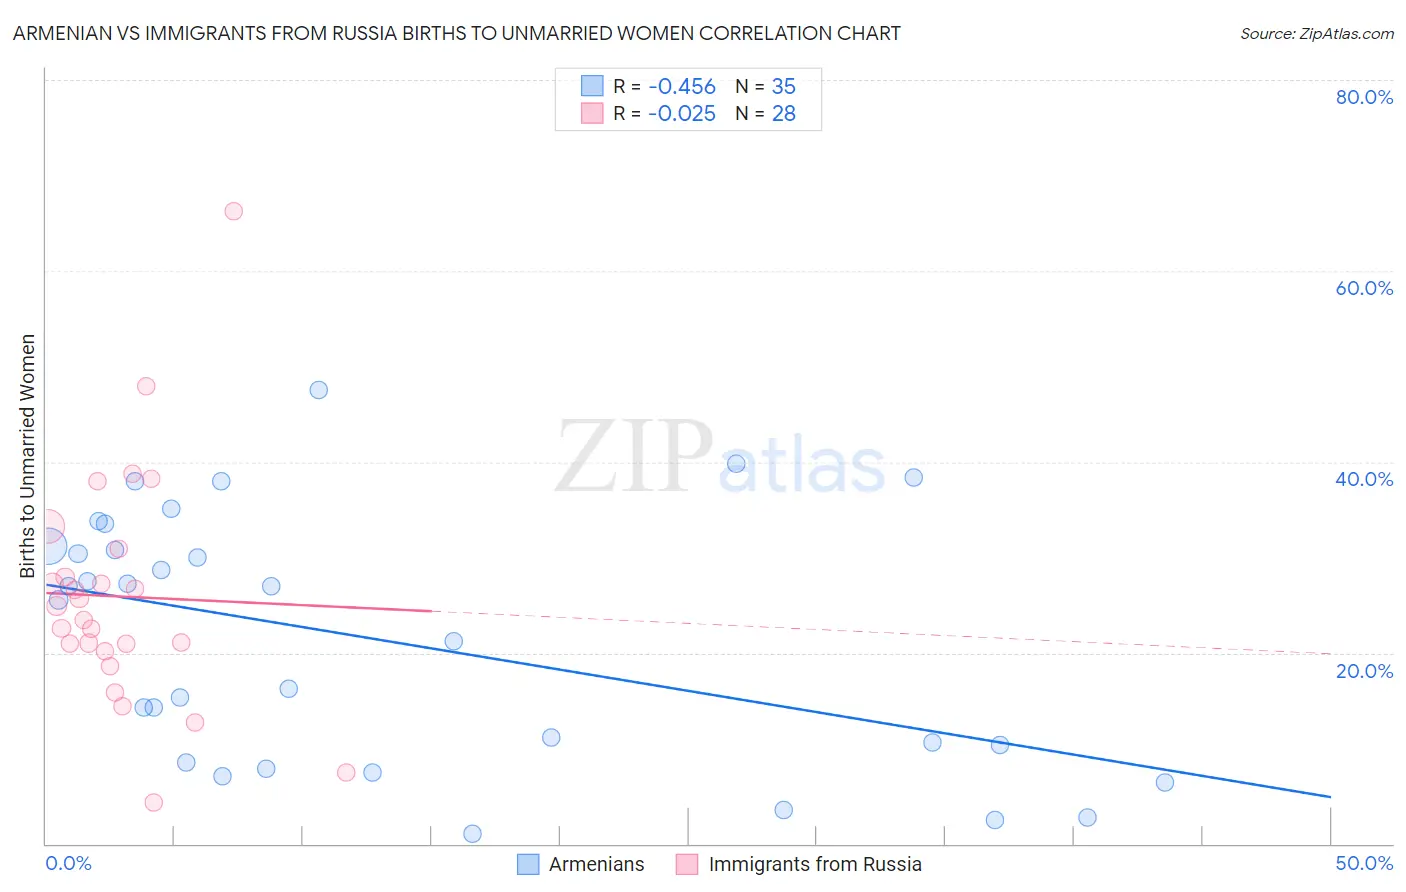
Armenian vs Immigrants from Russia Births to Unmarried Women Correlation Chart
The statistical analysis conducted on geographies consisting of 289,699,675 people shows a moderate negative correlation between the proportion of Armenians and percentage of births to unmarried women in the United States with a correlation coefficient (R) of -0.456 and weighted average of 26.2%. Similarly, the statistical analysis conducted on geographies consisting of 324,310,093 people shows no correlation between the proportion of Immigrants from Russia and percentage of births to unmarried women in the United States with a correlation coefficient (R) of -0.025 and weighted average of 27.1%, a difference of 3.6%.
Births to Unmarried Women Correlation Summary
| Measurement | Armenian | Immigrants from Russia |
| Minimum | 1.0% | 4.3% |
| Maximum | 47.5% | 66.3% |
| Range | 46.5% | 62.0% |
| Mean | 21.4% | 25.9% |
| Median | 25.5% | 24.2% |
| Interquartile 25% (IQ1) | 8.5% | 20.5% |
| Interquartile 75% (IQ3) | 31.1% | 29.4% |
| Interquartile Range (IQR) | 22.6% | 8.9% |
| Standard Deviation (Sample) | 13.1% | 12.3% |
| Standard Deviation (Population) | 12.9% | 12.1% |
Demographics Similar to Armenians and Immigrants from Russia by Births to Unmarried Women
In terms of births to unmarried women, the demographic groups most similar to Armenians are Immigrants from Korea (26.3%, a difference of 0.21%), Soviet Union (26.3%, a difference of 0.35%), Burmese (26.4%, a difference of 0.57%), Immigrants from Armenia (26.1%, a difference of 0.58%), and Immigrants from Japan (26.4%, a difference of 0.76%). Similarly, the demographic groups most similar to Immigrants from Russia are Immigrants from Iraq (27.1%, a difference of 0.030%), Immigrants from Sri Lanka (27.2%, a difference of 0.070%), Immigrants from Pakistan (27.2%, a difference of 0.11%), Immigrants from Ireland (27.2%, a difference of 0.19%), and Bulgarian (27.1%, a difference of 0.32%).
| Demographics | Rating | Rank | Births to Unmarried Women |
| Immigrants | Singapore | 100.0 /100 | #15 | Exceptional 25.6% |
| Immigrants | Belarus | 100.0 /100 | #16 | Exceptional 25.6% |
| Immigrants | Uzbekistan | 100.0 /100 | #17 | Exceptional 25.8% |
| Immigrants | Armenia | 99.9 /100 | #18 | Exceptional 26.1% |
| Armenians | 99.9 /100 | #19 | Exceptional 26.2% |
| Immigrants | Korea | 99.9 /100 | #20 | Exceptional 26.3% |
| Soviet Union | 99.9 /100 | #21 | Exceptional 26.3% |
| Burmese | 99.9 /100 | #22 | Exceptional 26.4% |
| Immigrants | Japan | 99.9 /100 | #23 | Exceptional 26.4% |
| Immigrants | Australia | 99.9 /100 | #24 | Exceptional 26.6% |
| Cambodians | 99.9 /100 | #25 | Exceptional 26.7% |
| Asians | 99.9 /100 | #26 | Exceptional 26.8% |
| Immigrants | Asia | 99.9 /100 | #27 | Exceptional 26.8% |
| Okinawans | 99.8 /100 | #28 | Exceptional 26.9% |
| Cypriots | 99.8 /100 | #29 | Exceptional 27.0% |
| Bulgarians | 99.8 /100 | #30 | Exceptional 27.1% |
| Immigrants | Iraq | 99.8 /100 | #31 | Exceptional 27.1% |
| Immigrants | Russia | 99.8 /100 | #32 | Exceptional 27.1% |
| Immigrants | Sri Lanka | 99.8 /100 | #33 | Exceptional 27.2% |
| Immigrants | Pakistan | 99.8 /100 | #34 | Exceptional 27.2% |
| Immigrants | Ireland | 99.7 /100 | #35 | Exceptional 27.2% |