Arapaho vs Immigrants from Zimbabwe Disability Age 65 to 74
COMPARE
Arapaho
Immigrants from Zimbabwe
Disability Age 65 to 74
Disability Age 65 to 74 Comparison
Arapaho
Immigrants from Zimbabwe
28.1%
DISABILITY AGE 65 TO 74
0.0/ 100
METRIC RATING
319th/ 347
METRIC RANK
22.3%
DISABILITY AGE 65 TO 74
96.1/ 100
METRIC RATING
108th/ 347
METRIC RANK
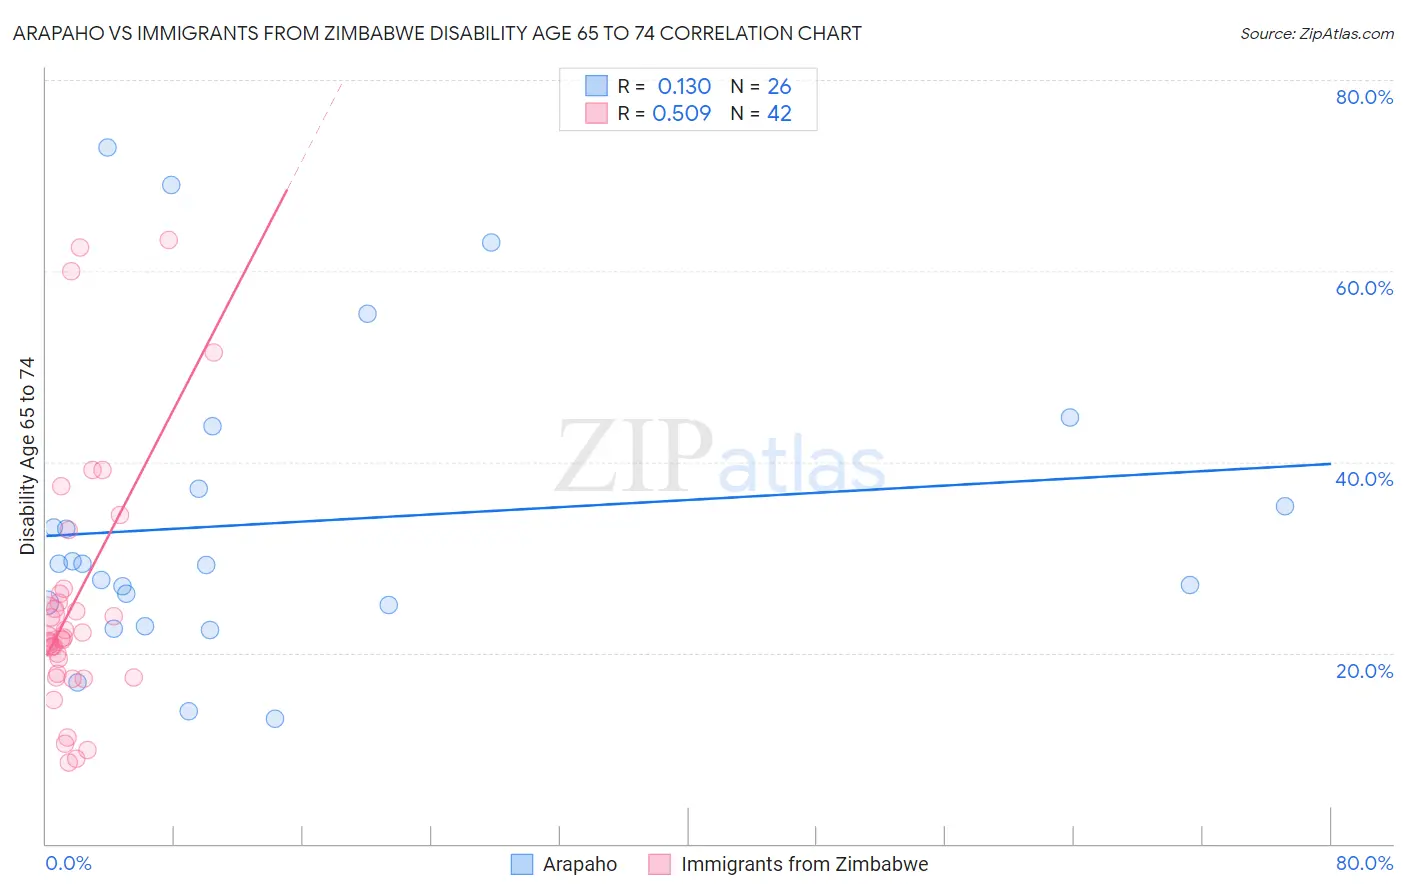
Arapaho vs Immigrants from Zimbabwe Disability Age 65 to 74 Correlation Chart
The statistical analysis conducted on geographies consisting of 29,768,926 people shows a poor positive correlation between the proportion of Arapaho and percentage of population with a disability between the ages 65 and 75 in the United States with a correlation coefficient (R) of 0.130 and weighted average of 28.1%. Similarly, the statistical analysis conducted on geographies consisting of 117,717,454 people shows a substantial positive correlation between the proportion of Immigrants from Zimbabwe and percentage of population with a disability between the ages 65 and 75 in the United States with a correlation coefficient (R) of 0.509 and weighted average of 22.3%, a difference of 26.2%.
Disability Age 65 to 74 Correlation Summary
| Measurement | Arapaho | Immigrants from Zimbabwe |
| Minimum | 13.0% | 8.6% |
| Maximum | 72.9% | 63.3% |
| Range | 59.9% | 54.7% |
| Mean | 33.6% | 25.4% |
| Median | 29.2% | 21.6% |
| Interquartile 25% (IQ1) | 25.0% | 17.8% |
| Interquartile 75% (IQ3) | 37.2% | 26.2% |
| Interquartile Range (IQR) | 12.2% | 8.4% |
| Standard Deviation (Sample) | 15.8% | 13.3% |
| Standard Deviation (Population) | 15.5% | 13.2% |
Similar Demographics by Disability Age 65 to 74
Demographics Similar to Arapaho by Disability Age 65 to 74
In terms of disability age 65 to 74, the demographic groups most similar to Arapaho are Nepalese (28.0%, a difference of 0.23%), Cherokee (28.2%, a difference of 0.39%), Immigrants from Armenia (28.0%, a difference of 0.45%), Crow (27.9%, a difference of 0.54%), and Cajun (27.9%, a difference of 0.58%).
| Demographics | Rating | Rank | Disability Age 65 to 74 |
| Osage | 0.0 /100 | #312 | Tragic 27.5% |
| Paiute | 0.0 /100 | #313 | Tragic 27.8% |
| Chippewa | 0.0 /100 | #314 | Tragic 27.8% |
| Cajuns | 0.0 /100 | #315 | Tragic 27.9% |
| Crow | 0.0 /100 | #316 | Tragic 27.9% |
| Immigrants | Armenia | 0.0 /100 | #317 | Tragic 28.0% |
| Nepalese | 0.0 /100 | #318 | Tragic 28.0% |
| Arapaho | 0.0 /100 | #319 | Tragic 28.1% |
| Cherokee | 0.0 /100 | #320 | Tragic 28.2% |
| Comanche | 0.0 /100 | #321 | Tragic 28.3% |
| Aleuts | 0.0 /100 | #322 | Tragic 28.4% |
| Puerto Ricans | 0.0 /100 | #323 | Tragic 29.1% |
| Seminole | 0.0 /100 | #324 | Tragic 29.4% |
| Dutch West Indians | 0.0 /100 | #325 | Tragic 29.6% |
| Yakama | 0.0 /100 | #326 | Tragic 29.6% |
Demographics Similar to Immigrants from Zimbabwe by Disability Age 65 to 74
In terms of disability age 65 to 74, the demographic groups most similar to Immigrants from Zimbabwe are Slovene (22.2%, a difference of 0.010%), Peruvian (22.2%, a difference of 0.020%), Palestinian (22.2%, a difference of 0.080%), Albanian (22.3%, a difference of 0.090%), and Colombian (22.2%, a difference of 0.12%).
| Demographics | Rating | Rank | Disability Age 65 to 74 |
| Immigrants | England | 96.5 /100 | #101 | Exceptional 22.2% |
| Immigrants | Saudi Arabia | 96.4 /100 | #102 | Exceptional 22.2% |
| South Americans | 96.4 /100 | #103 | Exceptional 22.2% |
| Colombians | 96.4 /100 | #104 | Exceptional 22.2% |
| Palestinians | 96.3 /100 | #105 | Exceptional 22.2% |
| Peruvians | 96.1 /100 | #106 | Exceptional 22.2% |
| Slovenes | 96.1 /100 | #107 | Exceptional 22.2% |
| Immigrants | Zimbabwe | 96.1 /100 | #108 | Exceptional 22.3% |
| Albanians | 95.8 /100 | #109 | Exceptional 22.3% |
| Immigrants | Peru | 95.7 /100 | #110 | Exceptional 22.3% |
| Serbians | 95.7 /100 | #111 | Exceptional 22.3% |
| Immigrants | South America | 95.5 /100 | #112 | Exceptional 22.3% |
| Syrians | 95.3 /100 | #113 | Exceptional 22.3% |
| Ukrainians | 95.1 /100 | #114 | Exceptional 22.3% |
| Laotians | 94.9 /100 | #115 | Exceptional 22.3% |