Apache vs Crow Unemployment Among Women with Children Ages 6 to 17 years
COMPARE
Apache
Crow
Unemployment Among Women with Children Ages 6 to 17 years
Unemployment Among Women with Children Ages 6 to 17 years Comparison
Apache
Crow
10.7%
UNEMPLOYMENT AMONG WOMEN WITH CHILDREN AGES 6 TO 17 YEARS
0.0/ 100
METRIC RATING
320th/ 347
METRIC RANK
9.2%
UNEMPLOYMENT AMONG WOMEN WITH CHILDREN AGES 6 TO 17 YEARS
5.8/ 100
METRIC RATING
221st/ 347
METRIC RANK
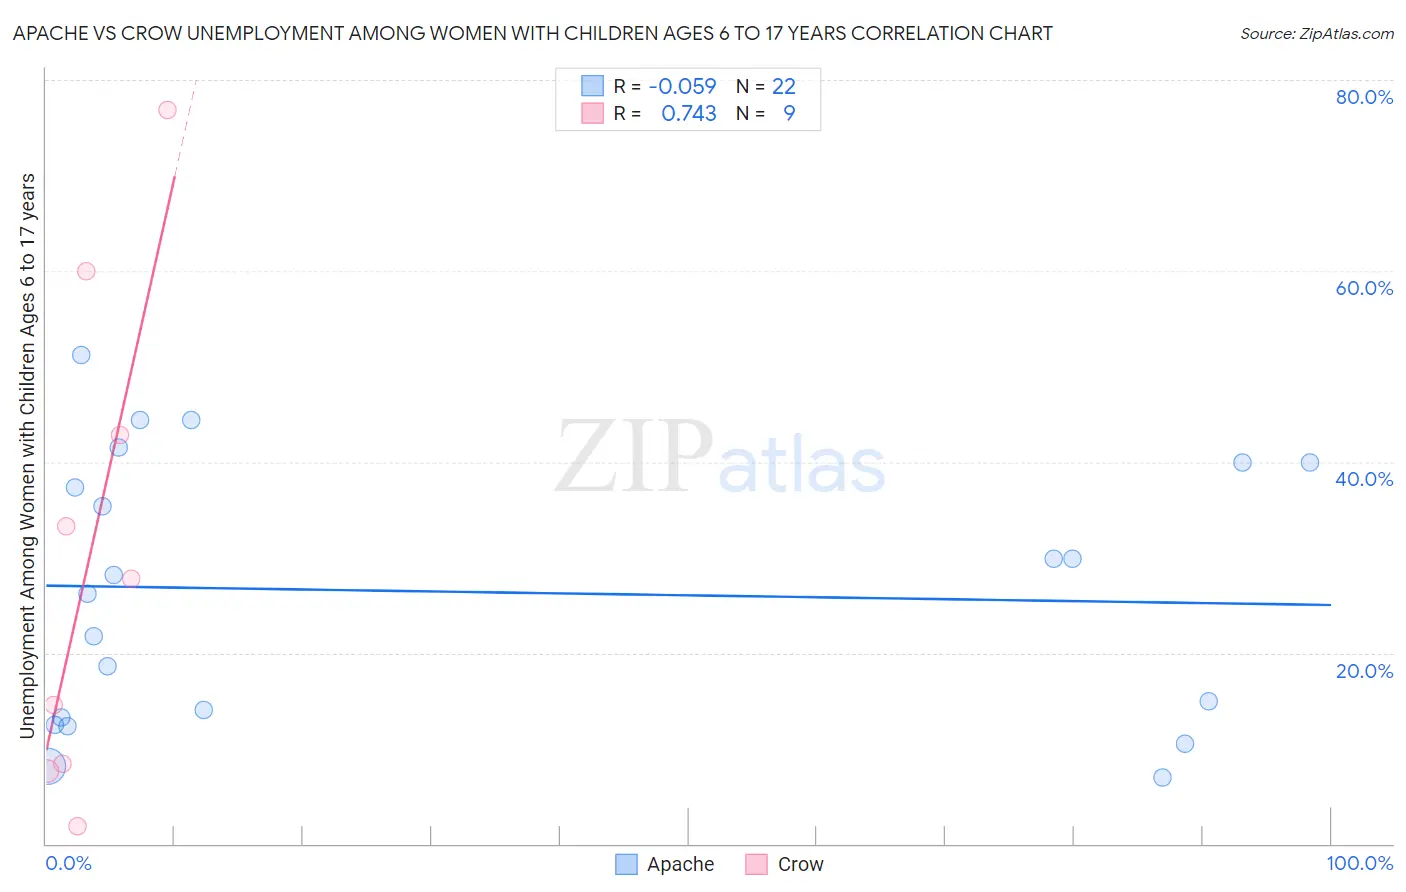
Apache vs Crow Unemployment Among Women with Children Ages 6 to 17 years Correlation Chart
The statistical analysis conducted on geographies consisting of 185,469,454 people shows a slight negative correlation between the proportion of Apache and unemployment rate among women with children between the ages 6 and 17 in the United States with a correlation coefficient (R) of -0.059 and weighted average of 10.7%. Similarly, the statistical analysis conducted on geographies consisting of 53,126,495 people shows a strong positive correlation between the proportion of Crow and unemployment rate among women with children between the ages 6 and 17 in the United States with a correlation coefficient (R) of 0.743 and weighted average of 9.2%, a difference of 15.3%.
Unemployment Among Women with Children Ages 6 to 17 years Correlation Summary
| Measurement | Apache | Crow |
| Minimum | 7.0% | 1.8% |
| Maximum | 51.1% | 76.9% |
| Range | 44.1% | 75.1% |
| Mean | 26.4% | 30.3% |
| Median | 27.2% | 27.8% |
| Interquartile 25% (IQ1) | 13.2% | 8.0% |
| Interquartile 75% (IQ3) | 40.0% | 51.4% |
| Interquartile Range (IQR) | 26.8% | 43.4% |
| Standard Deviation (Sample) | 13.8% | 25.7% |
| Standard Deviation (Population) | 13.5% | 24.2% |
Similar Demographics by Unemployment Among Women with Children Ages 6 to 17 years
Demographics Similar to Apache by Unemployment Among Women with Children Ages 6 to 17 years
In terms of unemployment among women with children ages 6 to 17 years, the demographic groups most similar to Apache are Immigrants from Uganda (10.7%, a difference of 0.020%), Tohono O'odham (10.7%, a difference of 0.17%), Delaware (10.5%, a difference of 1.3%), Bermudan (10.5%, a difference of 1.3%), and Immigrants from Dominica (10.5%, a difference of 1.5%).
| Demographics | Rating | Rank | Unemployment Among Women with Children Ages 6 to 17 years |
| Americans | 0.0 /100 | #313 | Tragic 10.4% |
| Immigrants | Cabo Verde | 0.0 /100 | #314 | Tragic 10.4% |
| Bahamians | 0.0 /100 | #315 | Tragic 10.4% |
| Immigrants | Dominica | 0.0 /100 | #316 | Tragic 10.5% |
| Bermudans | 0.0 /100 | #317 | Tragic 10.5% |
| Delaware | 0.0 /100 | #318 | Tragic 10.5% |
| Immigrants | Uganda | 0.0 /100 | #319 | Tragic 10.7% |
| Apache | 0.0 /100 | #320 | Tragic 10.7% |
| Tohono O'odham | 0.0 /100 | #321 | Tragic 10.7% |
| Cree | 0.0 /100 | #322 | Tragic 10.8% |
| Dominicans | 0.0 /100 | #323 | Tragic 10.8% |
| Immigrants | Dominican Republic | 0.0 /100 | #324 | Tragic 10.8% |
| Cajuns | 0.0 /100 | #325 | Tragic 10.8% |
| Liberians | 0.0 /100 | #326 | Tragic 10.8% |
| Cape Verdeans | 0.0 /100 | #327 | Tragic 10.9% |
Demographics Similar to Crow by Unemployment Among Women with Children Ages 6 to 17 years
In terms of unemployment among women with children ages 6 to 17 years, the demographic groups most similar to Crow are Immigrants from Southern Europe (9.2%, a difference of 0.010%), Immigrants from Eritrea (9.2%, a difference of 0.010%), Belgian (9.2%, a difference of 0.11%), Immigrants from El Salvador (9.3%, a difference of 0.12%), and Chinese (9.3%, a difference of 0.13%).
| Demographics | Rating | Rank | Unemployment Among Women with Children Ages 6 to 17 years |
| Iroquois | 7.5 /100 | #214 | Tragic 9.2% |
| Immigrants | Germany | 7.2 /100 | #215 | Tragic 9.2% |
| Immigrants | Uruguay | 7.2 /100 | #216 | Tragic 9.2% |
| Germans | 7.2 /100 | #217 | Tragic 9.2% |
| Syrians | 6.9 /100 | #218 | Tragic 9.2% |
| Immigrants | Scotland | 6.6 /100 | #219 | Tragic 9.2% |
| Belgians | 6.4 /100 | #220 | Tragic 9.2% |
| Crow | 5.8 /100 | #221 | Tragic 9.2% |
| Immigrants | Southern Europe | 5.8 /100 | #222 | Tragic 9.2% |
| Immigrants | Eritrea | 5.8 /100 | #223 | Tragic 9.2% |
| Immigrants | El Salvador | 5.3 /100 | #224 | Tragic 9.3% |
| Chinese | 5.2 /100 | #225 | Tragic 9.3% |
| Immigrants | Azores | 4.6 /100 | #226 | Tragic 9.3% |
| Panamanians | 4.5 /100 | #227 | Tragic 9.3% |
| Estonians | 4.4 /100 | #228 | Tragic 9.3% |