Aleut vs Slavic Family Households
COMPARE
Aleut
Slavic
Family Households
Family Households Comparison
Aleuts
Slavs
63.4%
FAMILY HOUSEHOLDS
1.9/ 100
METRIC RATING
239th/ 347
METRIC RANK
64.0%
FAMILY HOUSEHOLDS
18.6/ 100
METRIC RATING
199th/ 347
METRIC RANK
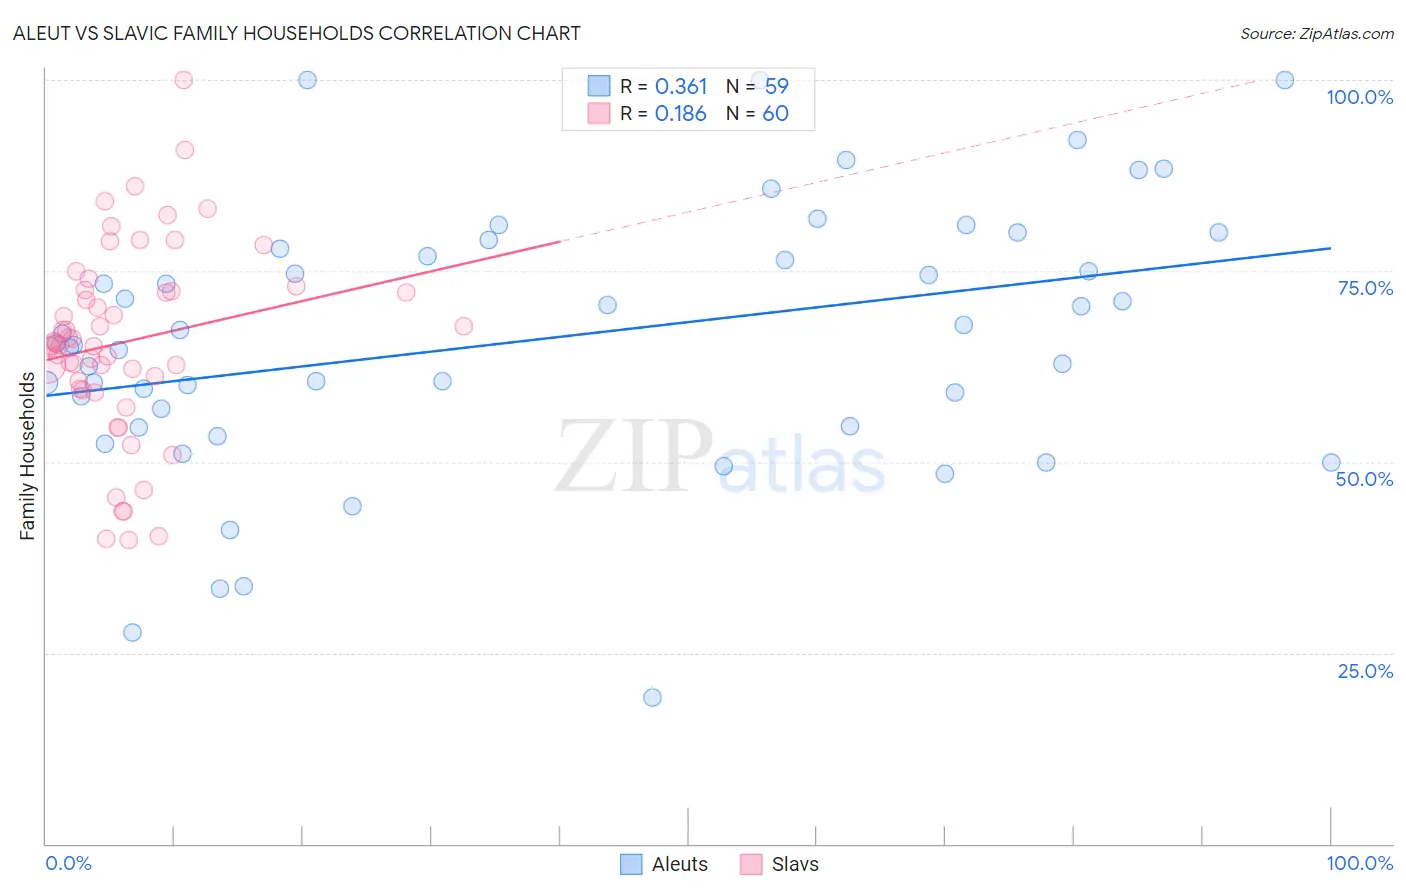
Aleut vs Slavic Family Households Correlation Chart
The statistical analysis conducted on geographies consisting of 61,774,066 people shows a mild positive correlation between the proportion of Aleuts and percentage of family households in the United States with a correlation coefficient (R) of 0.361 and weighted average of 63.4%. Similarly, the statistical analysis conducted on geographies consisting of 270,816,335 people shows a poor positive correlation between the proportion of Slavs and percentage of family households in the United States with a correlation coefficient (R) of 0.186 and weighted average of 64.0%, a difference of 0.84%.
Family Households Correlation Summary
| Measurement | Aleut | Slavic |
| Minimum | 19.2% | 39.7% |
| Maximum | 100.0% | 100.0% |
| Range | 80.8% | 60.3% |
| Mean | 66.1% | 65.7% |
| Median | 65.4% | 65.4% |
| Interquartile 25% (IQ1) | 54.7% | 60.1% |
| Interquartile 75% (IQ3) | 77.9% | 72.4% |
| Interquartile Range (IQR) | 23.2% | 12.4% |
| Standard Deviation (Sample) | 17.3% | 12.5% |
| Standard Deviation (Population) | 17.2% | 12.4% |
Similar Demographics by Family Households
Demographics Similar to Aleuts by Family Households
In terms of family households, the demographic groups most similar to Aleuts are South African (63.4%, a difference of 0.0%), Immigrants from St. Vincent and the Grenadines (63.4%, a difference of 0.010%), Immigrants from Israel (63.4%, a difference of 0.010%), Comanche (63.5%, a difference of 0.030%), and Immigrants from Zimbabwe (63.5%, a difference of 0.030%).
| Demographics | Rating | Rank | Family Households |
| Immigrants | Northern Africa | 2.6 /100 | #232 | Tragic 63.5% |
| Immigrants | Armenia | 2.6 /100 | #233 | Tragic 63.5% |
| Finns | 2.3 /100 | #234 | Tragic 63.5% |
| Albanians | 2.2 /100 | #235 | Tragic 63.5% |
| Ghanaians | 2.1 /100 | #236 | Tragic 63.5% |
| Comanche | 2.1 /100 | #237 | Tragic 63.5% |
| Immigrants | Zimbabwe | 2.0 /100 | #238 | Tragic 63.5% |
| Aleuts | 1.9 /100 | #239 | Tragic 63.4% |
| South Africans | 1.9 /100 | #240 | Tragic 63.4% |
| Immigrants | St. Vincent and the Grenadines | 1.9 /100 | #241 | Tragic 63.4% |
| Immigrants | Israel | 1.8 /100 | #242 | Tragic 63.4% |
| Immigrants | Czechoslovakia | 1.8 /100 | #243 | Tragic 63.4% |
| Eastern Europeans | 1.6 /100 | #244 | Tragic 63.4% |
| Immigrants | Dominica | 1.6 /100 | #245 | Tragic 63.4% |
| Immigrants | Ghana | 1.6 /100 | #246 | Tragic 63.4% |
Demographics Similar to Slavs by Family Households
In terms of family households, the demographic groups most similar to Slavs are Immigrants from Canada (64.0%, a difference of 0.010%), Seminole (64.0%, a difference of 0.010%), Polish (64.0%, a difference of 0.010%), Immigrants from Malaysia (64.0%, a difference of 0.020%), and Immigrants from North America (64.0%, a difference of 0.030%).
| Demographics | Rating | Rank | Family Households |
| Lithuanians | 23.8 /100 | #192 | Fair 64.0% |
| French | 23.7 /100 | #193 | Fair 64.0% |
| Paiute | 22.2 /100 | #194 | Fair 64.0% |
| Immigrants | North America | 20.0 /100 | #195 | Poor 64.0% |
| Immigrants | Canada | 19.2 /100 | #196 | Poor 64.0% |
| Seminole | 18.9 /100 | #197 | Poor 64.0% |
| Poles | 18.9 /100 | #198 | Poor 64.0% |
| Slavs | 18.6 /100 | #199 | Poor 64.0% |
| Immigrants | Malaysia | 17.9 /100 | #200 | Poor 64.0% |
| Immigrants | Eastern Europe | 17.2 /100 | #201 | Poor 64.0% |
| Iranians | 13.5 /100 | #202 | Poor 63.9% |
| Norwegians | 13.2 /100 | #203 | Poor 63.9% |
| Immigrants | Uruguay | 12.8 /100 | #204 | Poor 63.9% |
| Brazilians | 12.4 /100 | #205 | Poor 63.9% |
| Immigrants | Lithuania | 12.1 /100 | #206 | Poor 63.9% |