Alaska Native vs Immigrants from Poland Disability Age 65 to 74
COMPARE
Alaska Native
Immigrants from Poland
Disability Age 65 to 74
Disability Age 65 to 74 Comparison
Alaska Natives
Immigrants from Poland
30.6%
DISABILITY AGE 65 TO 74
0.0/ 100
METRIC RATING
334th/ 347
METRIC RANK
21.8%
DISABILITY AGE 65 TO 74
99.0/ 100
METRIC RATING
77th/ 347
METRIC RANK
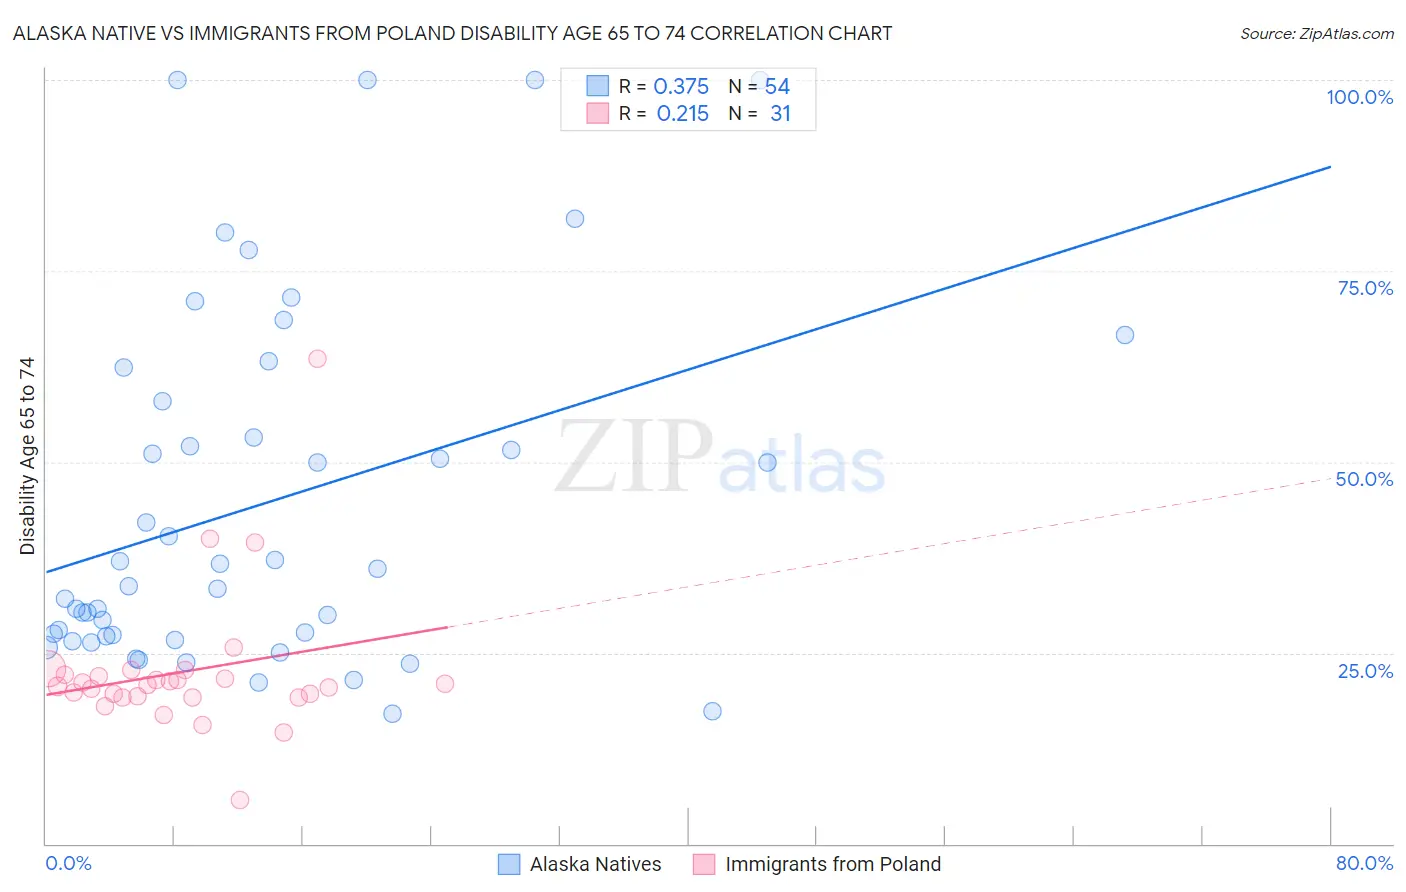
Alaska Native vs Immigrants from Poland Disability Age 65 to 74 Correlation Chart
The statistical analysis conducted on geographies consisting of 76,681,406 people shows a mild positive correlation between the proportion of Alaska Natives and percentage of population with a disability between the ages 65 and 75 in the United States with a correlation coefficient (R) of 0.375 and weighted average of 30.6%. Similarly, the statistical analysis conducted on geographies consisting of 304,591,665 people shows a weak positive correlation between the proportion of Immigrants from Poland and percentage of population with a disability between the ages 65 and 75 in the United States with a correlation coefficient (R) of 0.215 and weighted average of 21.8%, a difference of 40.6%.
Disability Age 65 to 74 Correlation Summary
| Measurement | Alaska Native | Immigrants from Poland |
| Minimum | 16.9% | 5.8% |
| Maximum | 100.0% | 63.5% |
| Range | 83.1% | 57.7% |
| Mean | 44.6% | 22.5% |
| Median | 34.9% | 20.8% |
| Interquartile 25% (IQ1) | 27.2% | 19.2% |
| Interquartile 75% (IQ3) | 58.0% | 22.1% |
| Interquartile Range (IQR) | 30.8% | 2.9% |
| Standard Deviation (Sample) | 23.4% | 9.7% |
| Standard Deviation (Population) | 23.2% | 9.5% |
Similar Demographics by Disability Age 65 to 74
Demographics Similar to Alaska Natives by Disability Age 65 to 74
In terms of disability age 65 to 74, the demographic groups most similar to Alaska Natives are Colville (30.5%, a difference of 0.25%), Native/Alaskan (30.4%, a difference of 0.77%), Chickasaw (30.2%, a difference of 1.4%), Creek (30.2%, a difference of 1.4%), and Choctaw (30.2%, a difference of 1.4%).
| Demographics | Rating | Rank | Disability Age 65 to 74 |
| Apache | 0.0 /100 | #327 | Tragic 29.7% |
| Hopi | 0.0 /100 | #328 | Tragic 30.0% |
| Choctaw | 0.0 /100 | #329 | Tragic 30.2% |
| Creek | 0.0 /100 | #330 | Tragic 30.2% |
| Chickasaw | 0.0 /100 | #331 | Tragic 30.2% |
| Natives/Alaskans | 0.0 /100 | #332 | Tragic 30.4% |
| Colville | 0.0 /100 | #333 | Tragic 30.5% |
| Alaska Natives | 0.0 /100 | #334 | Tragic 30.6% |
| Cheyenne | 0.0 /100 | #335 | Tragic 31.1% |
| Yuman | 0.0 /100 | #336 | Tragic 31.5% |
| Houma | 0.0 /100 | #337 | Tragic 32.3% |
| Alaskan Athabascans | 0.0 /100 | #338 | Tragic 32.4% |
| Kiowa | 0.0 /100 | #339 | Tragic 32.6% |
| Lumbee | 0.0 /100 | #340 | Tragic 32.7% |
| Tsimshian | 0.0 /100 | #341 | Tragic 32.9% |
Demographics Similar to Immigrants from Poland by Disability Age 65 to 74
In terms of disability age 65 to 74, the demographic groups most similar to Immigrants from Poland are Greek (21.8%, a difference of 0.060%), Immigrants from Eastern Europe (21.8%, a difference of 0.060%), Venezuelan (21.8%, a difference of 0.060%), Mongolian (21.8%, a difference of 0.070%), and Immigrants from Norway (21.8%, a difference of 0.070%).
| Demographics | Rating | Rank | Disability Age 65 to 74 |
| Chinese | 99.2 /100 | #70 | Exceptional 21.7% |
| Immigrants | Belarus | 99.2 /100 | #71 | Exceptional 21.7% |
| Immigrants | Hungary | 99.2 /100 | #72 | Exceptional 21.7% |
| Immigrants | Venezuela | 99.0 /100 | #73 | Exceptional 21.8% |
| Cambodians | 99.0 /100 | #74 | Exceptional 21.8% |
| Mongolians | 99.0 /100 | #75 | Exceptional 21.8% |
| Greeks | 99.0 /100 | #76 | Exceptional 21.8% |
| Immigrants | Poland | 99.0 /100 | #77 | Exceptional 21.8% |
| Immigrants | Eastern Europe | 99.0 /100 | #78 | Exceptional 21.8% |
| Venezuelans | 99.0 /100 | #79 | Exceptional 21.8% |
| Immigrants | Norway | 98.9 /100 | #80 | Exceptional 21.8% |
| Croatians | 98.9 /100 | #81 | Exceptional 21.8% |
| Immigrants | Indonesia | 98.7 /100 | #82 | Exceptional 21.9% |
| Immigrants | Brazil | 98.5 /100 | #83 | Exceptional 21.9% |
| Immigrants | Spain | 98.5 /100 | #84 | Exceptional 21.9% |