Alaska Native vs Arapaho Householder Income Ages 45 - 64 years
COMPARE
Alaska Native
Arapaho
Householder Income Ages 45 - 64 years
Householder Income Ages 45 - 64 years Comparison
Alaska Natives
Arapaho
$93,991
HOUSEHOLDER INCOME AGES 45 - 64 YEARS
4.0/ 100
METRIC RATING
227th/ 347
METRIC RANK
$75,945
HOUSEHOLDER INCOME AGES 45 - 64 YEARS
0.0/ 100
METRIC RATING
336th/ 347
METRIC RANK
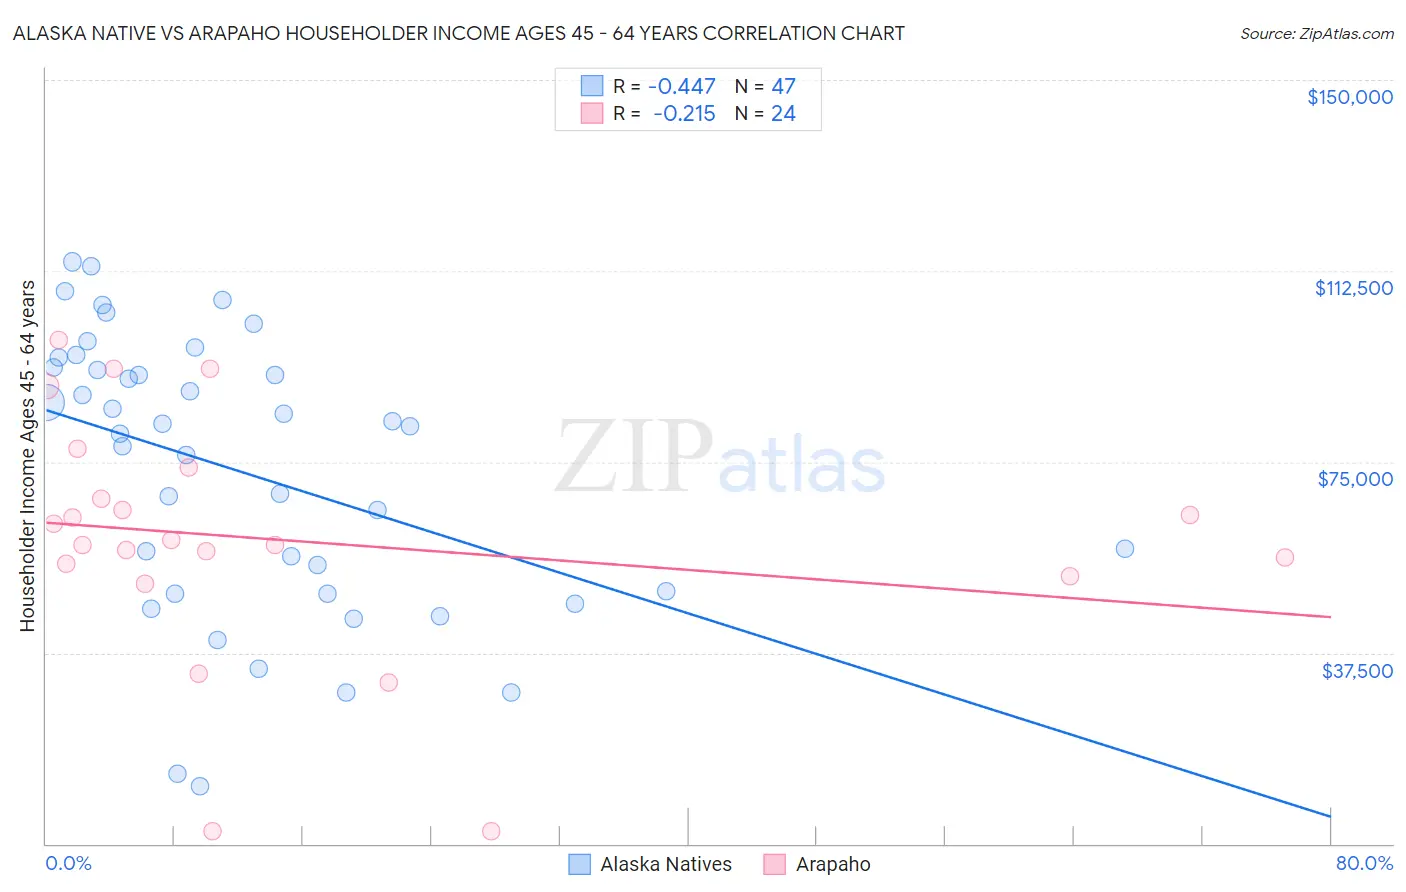
Alaska Native vs Arapaho Householder Income Ages 45 - 64 years Correlation Chart
The statistical analysis conducted on geographies consisting of 76,694,655 people shows a moderate negative correlation between the proportion of Alaska Natives and household income with householder between the ages 45 and 64 in the United States with a correlation coefficient (R) of -0.447 and weighted average of $93,991. Similarly, the statistical analysis conducted on geographies consisting of 29,759,321 people shows a weak negative correlation between the proportion of Arapaho and household income with householder between the ages 45 and 64 in the United States with a correlation coefficient (R) of -0.215 and weighted average of $75,945, a difference of 23.8%.
Householder Income Ages 45 - 64 years Correlation Summary
| Measurement | Alaska Native | Arapaho |
| Minimum | $11,250 | $2,499 |
| Maximum | $114,284 | $98,945 |
| Range | $103,034 | $96,446 |
| Mean | $73,165 | $59,533 |
| Median | $81,875 | $59,148 |
| Interquartile 25% (IQ1) | $49,167 | $53,794 |
| Interquartile 75% (IQ3) | $93,652 | $70,823 |
| Interquartile Range (IQR) | $44,485 | $17,029 |
| Standard Deviation (Sample) | $27,050 | $24,298 |
| Standard Deviation (Population) | $26,761 | $23,786 |
Similar Demographics by Householder Income Ages 45 - 64 years
Demographics Similar to Alaska Natives by Householder Income Ages 45 - 64 years
In terms of householder income ages 45 - 64 years, the demographic groups most similar to Alaska Natives are Immigrants from the Azores ($94,138, a difference of 0.16%), Immigrants from Panama ($93,815, a difference of 0.19%), Bermudan ($94,197, a difference of 0.22%), Vietnamese ($93,788, a difference of 0.22%), and Immigrants from Sudan ($93,781, a difference of 0.22%).
| Demographics | Rating | Rank | Householder Income Ages 45 - 64 years |
| Salvadorans | 6.0 /100 | #220 | Tragic $94,842 |
| Immigrants | Nigeria | 5.9 /100 | #221 | Tragic $94,804 |
| Malaysians | 5.2 /100 | #222 | Tragic $94,517 |
| Immigrants | Nonimmigrants | 5.0 /100 | #223 | Tragic $94,448 |
| Immigrants | Bosnia and Herzegovina | 4.6 /100 | #224 | Tragic $94,288 |
| Bermudans | 4.4 /100 | #225 | Tragic $94,197 |
| Immigrants | Azores | 4.3 /100 | #226 | Tragic $94,138 |
| Alaska Natives | 4.0 /100 | #227 | Tragic $93,991 |
| Immigrants | Panama | 3.7 /100 | #228 | Tragic $93,815 |
| Vietnamese | 3.6 /100 | #229 | Tragic $93,788 |
| Immigrants | Sudan | 3.6 /100 | #230 | Tragic $93,781 |
| Ecuadorians | 3.6 /100 | #231 | Tragic $93,739 |
| Sudanese | 3.5 /100 | #232 | Tragic $93,718 |
| Nepalese | 3.0 /100 | #233 | Tragic $93,355 |
| Immigrants | El Salvador | 2.7 /100 | #234 | Tragic $93,176 |
Demographics Similar to Arapaho by Householder Income Ages 45 - 64 years
In terms of householder income ages 45 - 64 years, the demographic groups most similar to Arapaho are Pueblo ($75,601, a difference of 0.45%), Hopi ($75,562, a difference of 0.51%), Cheyenne ($76,362, a difference of 0.55%), Menominee ($76,903, a difference of 1.3%), and Kiowa ($74,815, a difference of 1.5%).
| Demographics | Rating | Rank | Householder Income Ages 45 - 64 years |
| Dutch West Indians | 0.0 /100 | #329 | Tragic $79,171 |
| Creek | 0.0 /100 | #330 | Tragic $78,960 |
| Immigrants | Dominican Republic | 0.0 /100 | #331 | Tragic $78,836 |
| Blacks/African Americans | 0.0 /100 | #332 | Tragic $78,556 |
| Immigrants | Congo | 0.0 /100 | #333 | Tragic $77,850 |
| Menominee | 0.0 /100 | #334 | Tragic $76,903 |
| Cheyenne | 0.0 /100 | #335 | Tragic $76,362 |
| Arapaho | 0.0 /100 | #336 | Tragic $75,945 |
| Pueblo | 0.0 /100 | #337 | Tragic $75,601 |
| Hopi | 0.0 /100 | #338 | Tragic $75,562 |
| Kiowa | 0.0 /100 | #339 | Tragic $74,815 |
| Immigrants | Yemen | 0.0 /100 | #340 | Tragic $74,575 |
| Crow | 0.0 /100 | #341 | Tragic $74,257 |
| Tohono O'odham | 0.0 /100 | #342 | Tragic $73,774 |
| Pima | 0.0 /100 | #343 | Tragic $73,365 |