Alaska Native vs Chilean Currently Married
COMPARE
Alaska Native
Chilean
Currently Married
Currently Married Comparison
Alaska Natives
Chileans
45.5%
CURRENTLY MARRIED
7.0/ 100
METRIC RATING
213th/ 347
METRIC RANK
47.0%
CURRENTLY MARRIED
69.8/ 100
METRIC RATING
151st/ 347
METRIC RANK
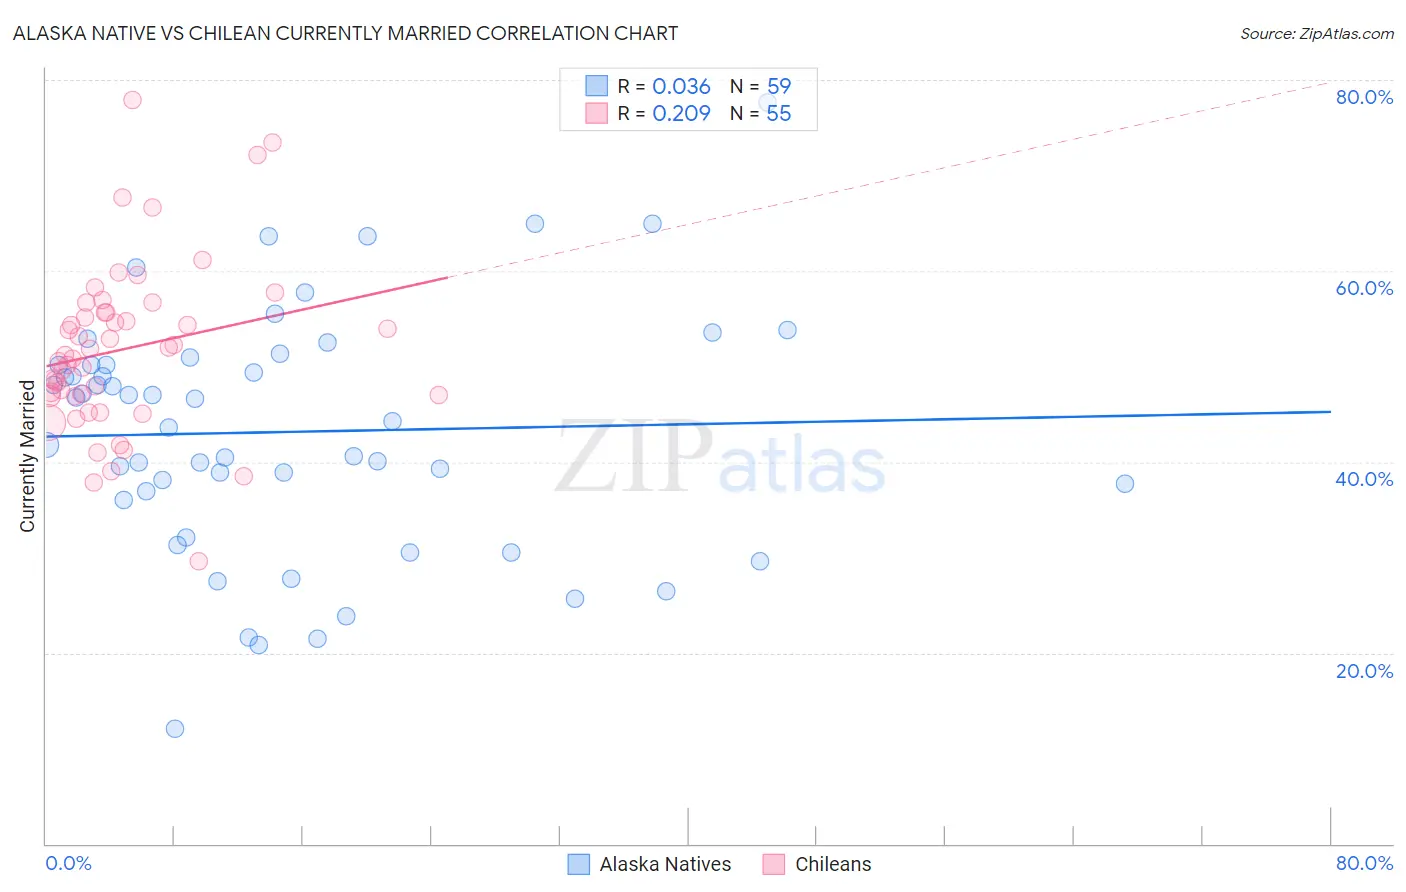
Alaska Native vs Chilean Currently Married Correlation Chart
The statistical analysis conducted on geographies consisting of 76,776,837 people shows no correlation between the proportion of Alaska Natives and percentage of population currently married in the United States with a correlation coefficient (R) of 0.036 and weighted average of 45.5%. Similarly, the statistical analysis conducted on geographies consisting of 256,662,716 people shows a weak positive correlation between the proportion of Chileans and percentage of population currently married in the United States with a correlation coefficient (R) of 0.209 and weighted average of 47.0%, a difference of 3.2%.
Currently Married Correlation Summary
| Measurement | Alaska Native | Chilean |
| Minimum | 12.1% | 29.6% |
| Maximum | 77.7% | 78.0% |
| Range | 65.6% | 48.4% |
| Mean | 43.1% | 51.8% |
| Median | 44.2% | 51.2% |
| Interquartile 25% (IQ1) | 36.0% | 46.9% |
| Interquartile 75% (IQ3) | 50.2% | 55.6% |
| Interquartile Range (IQR) | 14.1% | 8.7% |
| Standard Deviation (Sample) | 12.8% | 8.9% |
| Standard Deviation (Population) | 12.7% | 8.8% |
Similar Demographics by Currently Married
Demographics Similar to Alaska Natives by Currently Married
In terms of currently married, the demographic groups most similar to Alaska Natives are Marshallese (45.5%, a difference of 0.030%), Houma (45.5%, a difference of 0.040%), Dutch West Indian (45.5%, a difference of 0.040%), German Russian (45.5%, a difference of 0.040%), and Uruguayan (45.6%, a difference of 0.12%).
| Demographics | Rating | Rank | Currently Married |
| Immigrants | Immigrants | 11.2 /100 | #206 | Poor 45.8% |
| Immigrants | South America | 10.8 /100 | #207 | Poor 45.7% |
| Alsatians | 10.8 /100 | #208 | Poor 45.7% |
| Immigrants | Micronesia | 8.8 /100 | #209 | Tragic 45.6% |
| Uruguayans | 7.9 /100 | #210 | Tragic 45.6% |
| Houma | 7.2 /100 | #211 | Tragic 45.5% |
| Marshallese | 7.2 /100 | #212 | Tragic 45.5% |
| Alaska Natives | 7.0 /100 | #213 | Tragic 45.5% |
| Dutch West Indians | 6.7 /100 | #214 | Tragic 45.5% |
| German Russians | 6.7 /100 | #215 | Tragic 45.5% |
| Immigrants | Morocco | 5.5 /100 | #216 | Tragic 45.4% |
| Immigrants | Thailand | 5.1 /100 | #217 | Tragic 45.4% |
| Panamanians | 4.0 /100 | #218 | Tragic 45.3% |
| Immigrants | Portugal | 3.5 /100 | #219 | Tragic 45.2% |
| Kenyans | 3.1 /100 | #220 | Tragic 45.2% |
Demographics Similar to Chileans by Currently Married
In terms of currently married, the demographic groups most similar to Chileans are Zimbabwean (47.0%, a difference of 0.010%), Immigrants from Turkey (47.0%, a difference of 0.010%), Cambodian (47.0%, a difference of 0.030%), Immigrants from Serbia (47.0%, a difference of 0.040%), and Immigrants from Venezuela (47.0%, a difference of 0.050%).
| Demographics | Rating | Rank | Currently Married |
| Hmong | 73.4 /100 | #144 | Good 47.1% |
| Immigrants | South Eastern Asia | 72.9 /100 | #145 | Good 47.1% |
| Carpatho Rusyns | 72.6 /100 | #146 | Good 47.0% |
| Immigrants | Argentina | 72.0 /100 | #147 | Good 47.0% |
| Cambodians | 70.4 /100 | #148 | Good 47.0% |
| Zimbabweans | 70.1 /100 | #149 | Good 47.0% |
| Immigrants | Turkey | 70.0 /100 | #150 | Good 47.0% |
| Chileans | 69.8 /100 | #151 | Good 47.0% |
| Immigrants | Serbia | 68.8 /100 | #152 | Good 47.0% |
| Immigrants | Venezuela | 68.6 /100 | #153 | Good 47.0% |
| Albanians | 68.6 /100 | #154 | Good 47.0% |
| Arabs | 68.6 /100 | #155 | Good 47.0% |
| Spanish | 68.1 /100 | #156 | Good 47.0% |
| Immigrants | Switzerland | 67.8 /100 | #157 | Good 46.9% |
| Cherokee | 66.8 /100 | #158 | Good 46.9% |