African vs Houma Births to Unmarried Women
COMPARE
African
Houma
Births to Unmarried Women
Births to Unmarried Women Comparison
Africans
Houma
39.7%
BIRTHS TO UNMARRIED WOMEN
0.0/ 100
METRIC RATING
313th/ 347
METRIC RANK
46.6%
BIRTHS TO UNMARRIED WOMEN
0.0/ 100
METRIC RATING
337th/ 347
METRIC RANK
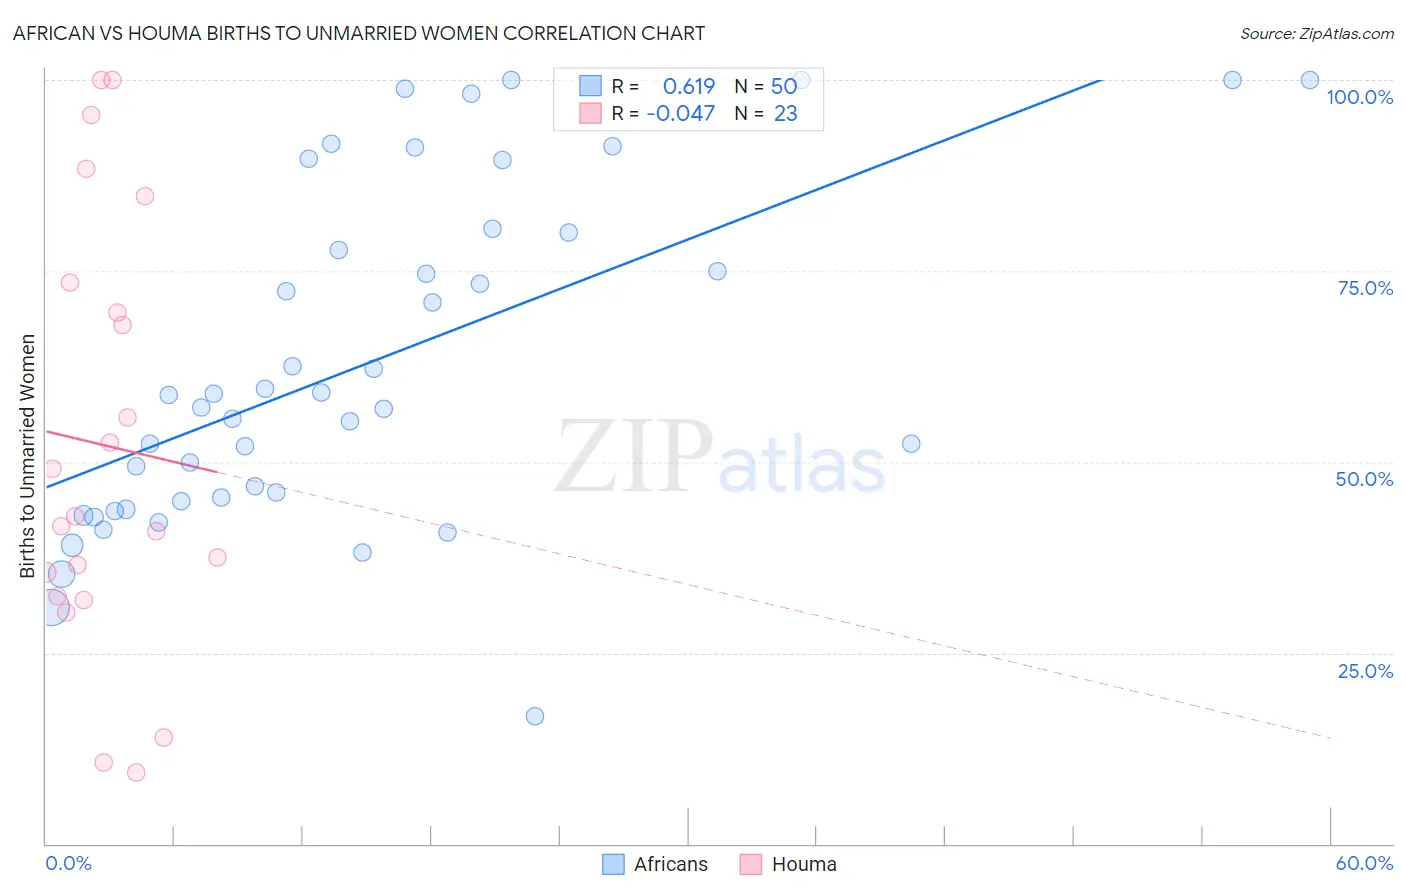
African vs Houma Births to Unmarried Women Correlation Chart
The statistical analysis conducted on geographies consisting of 441,094,668 people shows a significant positive correlation between the proportion of Africans and percentage of births to unmarried women in the United States with a correlation coefficient (R) of 0.619 and weighted average of 39.7%. Similarly, the statistical analysis conducted on geographies consisting of 36,513,880 people shows no correlation between the proportion of Houma and percentage of births to unmarried women in the United States with a correlation coefficient (R) of -0.047 and weighted average of 46.6%, a difference of 17.2%.
Births to Unmarried Women Correlation Summary
| Measurement | African | Houma |
| Minimum | 16.7% | 9.3% |
| Maximum | 100.0% | 100.0% |
| Range | 83.3% | 90.7% |
| Mean | 62.7% | 52.2% |
| Median | 58.0% | 42.9% |
| Interquartile 25% (IQ1) | 44.9% | 32.4% |
| Interquartile 75% (IQ3) | 80.0% | 73.4% |
| Interquartile Range (IQR) | 35.1% | 41.0% |
| Standard Deviation (Sample) | 21.9% | 28.0% |
| Standard Deviation (Population) | 21.6% | 27.3% |
Similar Demographics by Births to Unmarried Women
Demographics Similar to Africans by Births to Unmarried Women
In terms of births to unmarried women, the demographic groups most similar to Africans are Immigrants from Caribbean (39.8%, a difference of 0.29%), Dominican (39.8%, a difference of 0.33%), U.S. Virgin Islander (39.6%, a difference of 0.34%), Immigrants from the Azores (39.6%, a difference of 0.36%), and Apache (39.9%, a difference of 0.38%).
| Demographics | Rating | Rank | Births to Unmarried Women |
| Central American Indians | 0.0 /100 | #306 | Tragic 39.0% |
| Immigrants | Honduras | 0.0 /100 | #307 | Tragic 39.3% |
| Aleuts | 0.0 /100 | #308 | Tragic 39.3% |
| Cubans | 0.0 /100 | #309 | Tragic 39.4% |
| Immigrants | Dominica | 0.0 /100 | #310 | Tragic 39.5% |
| Immigrants | Azores | 0.0 /100 | #311 | Tragic 39.6% |
| U.S. Virgin Islanders | 0.0 /100 | #312 | Tragic 39.6% |
| Africans | 0.0 /100 | #313 | Tragic 39.7% |
| Immigrants | Caribbean | 0.0 /100 | #314 | Tragic 39.8% |
| Dominicans | 0.0 /100 | #315 | Tragic 39.8% |
| Apache | 0.0 /100 | #316 | Tragic 39.9% |
| Immigrants | Dominican Republic | 0.0 /100 | #317 | Tragic 40.1% |
| Immigrants | Bahamas | 0.0 /100 | #318 | Tragic 40.1% |
| Yakama | 0.0 /100 | #319 | Tragic 40.3% |
| Crow | 0.0 /100 | #320 | Tragic 40.4% |
Demographics Similar to Houma by Births to Unmarried Women
In terms of births to unmarried women, the demographic groups most similar to Houma are Arapaho (47.1%, a difference of 1.2%), Puerto Rican (45.7%, a difference of 1.9%), Colville (45.3%, a difference of 2.7%), Lumbee (48.2%, a difference of 3.5%), and Yuman (44.4%, a difference of 4.9%).
| Demographics | Rating | Rank | Births to Unmarried Women |
| Chippewa | 0.0 /100 | #330 | Tragic 42.6% |
| Natives/Alaskans | 0.0 /100 | #331 | Tragic 43.0% |
| Kiowa | 0.0 /100 | #332 | Tragic 43.1% |
| Blacks/African Americans | 0.0 /100 | #333 | Tragic 44.3% |
| Yuman | 0.0 /100 | #334 | Tragic 44.4% |
| Colville | 0.0 /100 | #335 | Tragic 45.3% |
| Puerto Ricans | 0.0 /100 | #336 | Tragic 45.7% |
| Houma | 0.0 /100 | #337 | Tragic 46.6% |
| Arapaho | 0.0 /100 | #338 | Tragic 47.1% |
| Lumbee | 0.0 /100 | #339 | Tragic 48.2% |
| Tohono O'odham | 0.0 /100 | #340 | Tragic 49.8% |
| Hopi | 0.0 /100 | #341 | Tragic 50.8% |
| Menominee | 0.0 /100 | #342 | Tragic 51.1% |
| Pima | 0.0 /100 | #343 | Tragic 51.5% |
| Navajo | 0.0 /100 | #344 | Tragic 51.5% |