Immigrants from Morocco vs German Average Family Size
COMPARE
Immigrants from Morocco
German
Average Family Size
Average Family Size Comparison
Immigrants from Morocco
Germans
3.21
AVERAGE FAMILY SIZE
18.5/ 100
METRIC RATING
201st/ 347
METRIC RANK
3.09
AVERAGE FAMILY SIZE
0.0/ 100
METRIC RATING
342nd/ 347
METRIC RANK
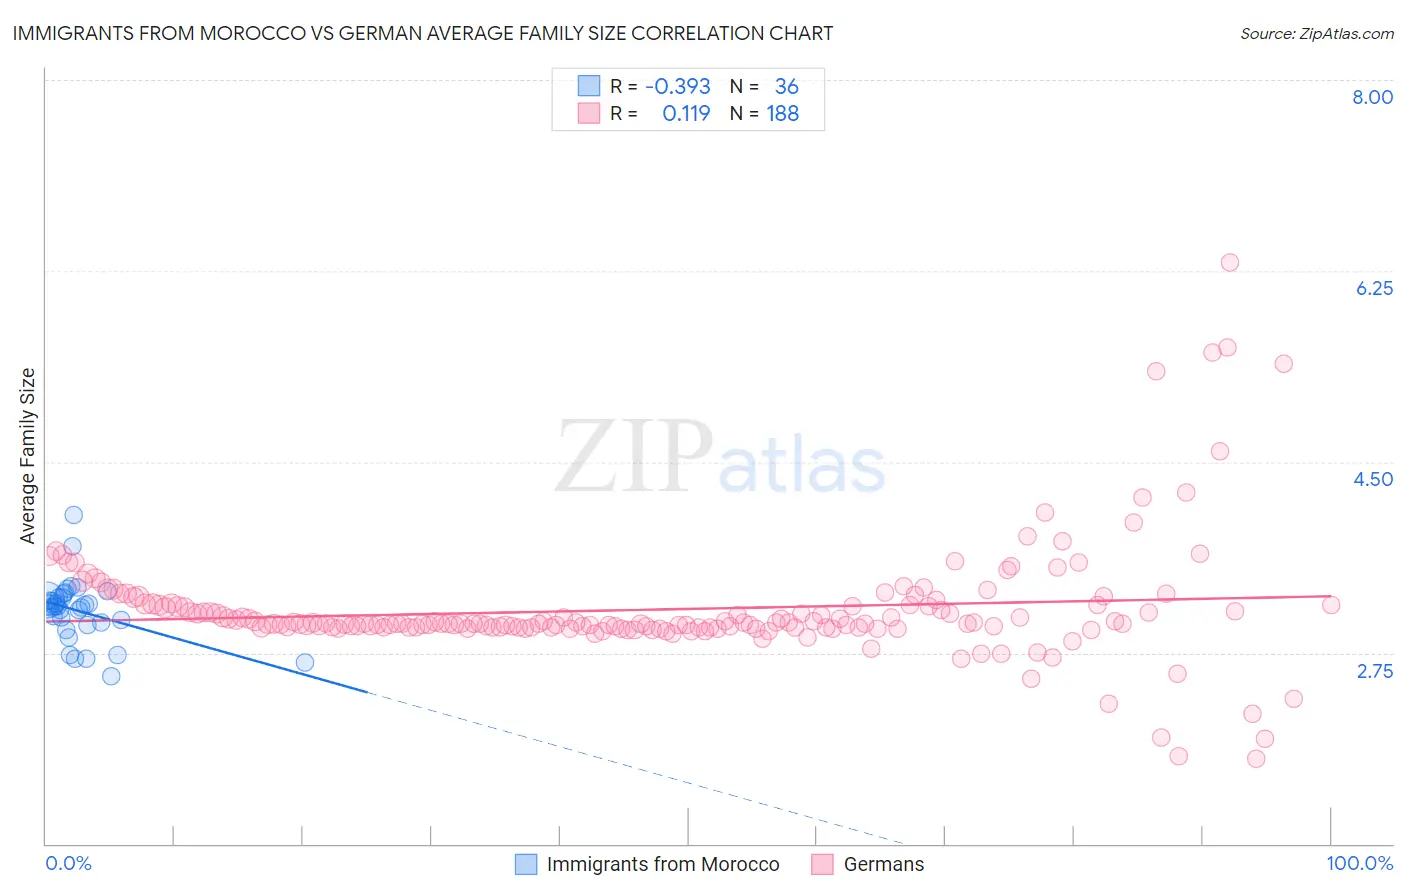
Immigrants from Morocco vs German Average Family Size Correlation Chart
The statistical analysis conducted on geographies consisting of 178,909,598 people shows a mild negative correlation between the proportion of Immigrants from Morocco and average family size in the United States with a correlation coefficient (R) of -0.393 and weighted average of 3.21. Similarly, the statistical analysis conducted on geographies consisting of 580,609,080 people shows a poor positive correlation between the proportion of Germans and average family size in the United States with a correlation coefficient (R) of 0.119 and weighted average of 3.09, a difference of 3.8%.
Average Family Size Correlation Summary
| Measurement | Immigrants from Morocco | German |
| Minimum | 2.53 | 1.78 |
| Maximum | 4.01 | 6.33 |
| Range | 1.48 | 4.55 |
| Mean | 3.13 | 3.15 |
| Median | 3.18 | 3.02 |
| Interquartile 25% (IQ1) | 3.02 | 2.98 |
| Interquartile 75% (IQ3) | 3.26 | 3.18 |
| Interquartile Range (IQR) | 0.24 | 0.20 |
| Standard Deviation (Sample) | 0.29 | 0.54 |
| Standard Deviation (Population) | 0.28 | 0.54 |
Similar Demographics by Average Family Size
Demographics Similar to Immigrants from Morocco by Average Family Size
In terms of average family size, the demographic groups most similar to Immigrants from Morocco are Immigrants from India (3.21, a difference of 0.0%), Immigrants from Nepal (3.21, a difference of 0.010%), Immigrants from Kenya (3.21, a difference of 0.020%), Hmong (3.21, a difference of 0.060%), and Immigrants from Poland (3.20, a difference of 0.060%).
| Demographics | Rating | Rank | Average Family Size |
| Immigrants | Sudan | 29.1 /100 | #194 | Fair 3.22 |
| Choctaw | 28.3 /100 | #195 | Fair 3.21 |
| Senegalese | 28.2 /100 | #196 | Fair 3.21 |
| Kenyans | 28.0 /100 | #197 | Fair 3.21 |
| Immigrants | Azores | 21.7 /100 | #198 | Fair 3.21 |
| Hmong | 20.7 /100 | #199 | Fair 3.21 |
| Immigrants | Kenya | 19.2 /100 | #200 | Poor 3.21 |
| Immigrants | Morocco | 18.5 /100 | #201 | Poor 3.21 |
| Immigrants | India | 18.5 /100 | #202 | Poor 3.21 |
| Immigrants | Nepal | 18.1 /100 | #203 | Poor 3.21 |
| Immigrants | Poland | 16.6 /100 | #204 | Poor 3.20 |
| Paraguayans | 16.3 /100 | #205 | Poor 3.20 |
| Immigrants | Cabo Verde | 16.0 /100 | #206 | Poor 3.20 |
| Filipinos | 13.6 /100 | #207 | Poor 3.20 |
| Chippewa | 13.3 /100 | #208 | Poor 3.20 |
Demographics Similar to Germans by Average Family Size
In terms of average family size, the demographic groups most similar to Germans are Polish (3.09, a difference of 0.14%), Finnish (3.09, a difference of 0.19%), Norwegian (3.08, a difference of 0.23%), Croatian (3.10, a difference of 0.33%), and French (3.10, a difference of 0.34%).
| Demographics | Rating | Rank | Average Family Size |
| Estonians | 0.0 /100 | #333 | Tragic 3.10 |
| Lithuanians | 0.0 /100 | #334 | Tragic 3.10 |
| Luxembourgers | 0.0 /100 | #335 | Tragic 3.10 |
| Irish | 0.0 /100 | #336 | Tragic 3.10 |
| Swedes | 0.0 /100 | #337 | Tragic 3.10 |
| French | 0.0 /100 | #338 | Tragic 3.10 |
| Croatians | 0.0 /100 | #339 | Tragic 3.10 |
| Finns | 0.0 /100 | #340 | Tragic 3.09 |
| Poles | 0.0 /100 | #341 | Tragic 3.09 |
| Germans | 0.0 /100 | #342 | Tragic 3.09 |
| Norwegians | 0.0 /100 | #343 | Tragic 3.08 |
| French Canadians | 0.0 /100 | #344 | Tragic 3.07 |
| Slovenes | 0.0 /100 | #345 | Tragic 3.07 |
| Slovaks | 0.0 /100 | #346 | Tragic 3.06 |
| Carpatho Rusyns | 0.0 /100 | #347 | Tragic 3.06 |