African vs Ecuadorian 3rd Grade
COMPARE
African
Ecuadorian
3rd Grade
3rd Grade Comparison
Africans
Ecuadorians
97.6%
3RD GRADE
14.5/ 100
METRIC RATING
205th/ 347
METRIC RANK
96.7%
3RD GRADE
0.0/ 100
METRIC RATING
303rd/ 347
METRIC RANK
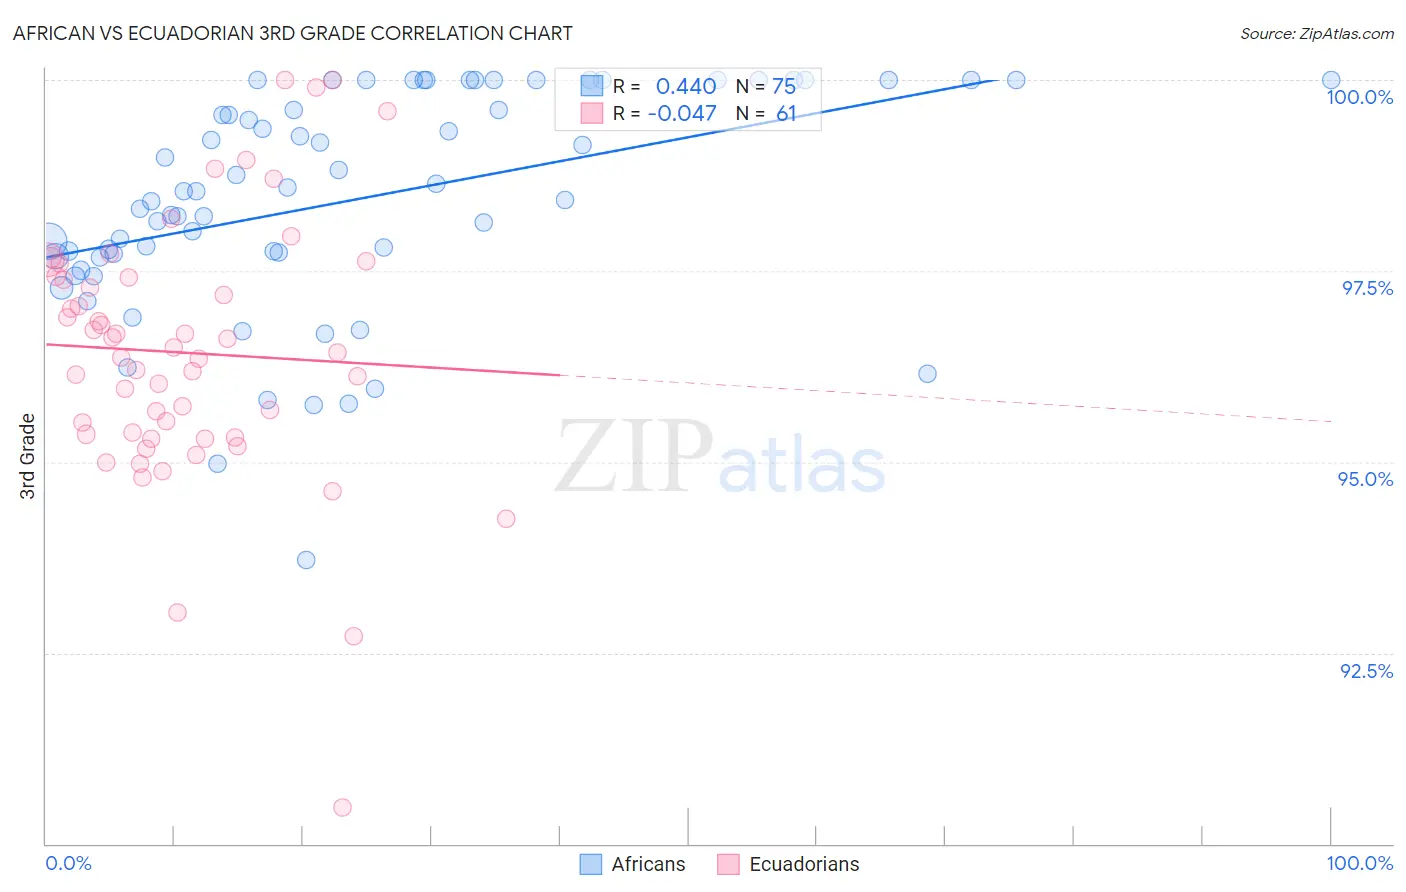
African vs Ecuadorian 3rd Grade Correlation Chart
The statistical analysis conducted on geographies consisting of 470,094,148 people shows a moderate positive correlation between the proportion of Africans and percentage of population with at least 3rd grade education in the United States with a correlation coefficient (R) of 0.440 and weighted average of 97.6%. Similarly, the statistical analysis conducted on geographies consisting of 317,865,723 people shows no correlation between the proportion of Ecuadorians and percentage of population with at least 3rd grade education in the United States with a correlation coefficient (R) of -0.047 and weighted average of 96.7%, a difference of 0.89%.
3rd Grade Correlation Summary
| Measurement | African | Ecuadorian |
| Minimum | 93.7% | 90.5% |
| Maximum | 100.0% | 100.0% |
| Range | 6.3% | 9.5% |
| Mean | 98.4% | 96.4% |
| Median | 98.5% | 96.4% |
| Interquartile 25% (IQ1) | 97.7% | 95.3% |
| Interquartile 75% (IQ3) | 100.0% | 97.4% |
| Interquartile Range (IQR) | 2.3% | 2.1% |
| Standard Deviation (Sample) | 1.4% | 1.7% |
| Standard Deviation (Population) | 1.4% | 1.7% |
Similar Demographics by 3rd Grade
Demographics Similar to Africans by 3rd Grade
In terms of 3rd grade, the demographic groups most similar to Africans are Paiute (97.6%, a difference of 0.010%), Immigrants from Chile (97.6%, a difference of 0.010%), Immigrants from Northern Africa (97.6%, a difference of 0.010%), Tohono O'odham (97.6%, a difference of 0.010%), and Immigrants from Southern Europe (97.6%, a difference of 0.020%).
| Demographics | Rating | Rank | 3rd Grade |
| Guamanians/Chamorros | 23.6 /100 | #198 | Fair 97.7% |
| Immigrants | Ukraine | 22.7 /100 | #199 | Fair 97.7% |
| Immigrants | Albania | 22.6 /100 | #200 | Fair 97.7% |
| Immigrants | Lebanon | 21.7 /100 | #201 | Fair 97.7% |
| Immigrants | Southern Europe | 17.7 /100 | #202 | Poor 97.6% |
| Paiute | 16.7 /100 | #203 | Poor 97.6% |
| Immigrants | Chile | 16.5 /100 | #204 | Poor 97.6% |
| Africans | 14.5 /100 | #205 | Poor 97.6% |
| Immigrants | Northern Africa | 13.0 /100 | #206 | Poor 97.6% |
| Tohono O'odham | 12.5 /100 | #207 | Poor 97.6% |
| Immigrants | Zaire | 11.9 /100 | #208 | Poor 97.6% |
| Costa Ricans | 9.6 /100 | #209 | Tragic 97.6% |
| Immigrants | Oceania | 9.5 /100 | #210 | Tragic 97.6% |
| Laotians | 9.4 /100 | #211 | Tragic 97.6% |
| Immigrants | Bahamas | 8.5 /100 | #212 | Tragic 97.6% |
Demographics Similar to Ecuadorians by 3rd Grade
In terms of 3rd grade, the demographic groups most similar to Ecuadorians are Immigrants from Somalia (96.8%, a difference of 0.010%), Immigrants from Caribbean (96.7%, a difference of 0.020%), Central American Indian (96.7%, a difference of 0.030%), Guyanese (96.7%, a difference of 0.060%), and Immigrants from Cuba (96.8%, a difference of 0.080%).
| Demographics | Rating | Rank | 3rd Grade |
| Immigrants | Immigrants | 0.0 /100 | #296 | Tragic 96.9% |
| Haitians | 0.0 /100 | #297 | Tragic 96.9% |
| Immigrants | Dominica | 0.0 /100 | #298 | Tragic 96.9% |
| Somalis | 0.0 /100 | #299 | Tragic 96.8% |
| Immigrants | South Eastern Asia | 0.0 /100 | #300 | Tragic 96.8% |
| Immigrants | Cuba | 0.0 /100 | #301 | Tragic 96.8% |
| Immigrants | Somalia | 0.0 /100 | #302 | Tragic 96.8% |
| Ecuadorians | 0.0 /100 | #303 | Tragic 96.7% |
| Immigrants | Caribbean | 0.0 /100 | #304 | Tragic 96.7% |
| Central American Indians | 0.0 /100 | #305 | Tragic 96.7% |
| Guyanese | 0.0 /100 | #306 | Tragic 96.7% |
| Nicaraguans | 0.0 /100 | #307 | Tragic 96.7% |
| Immigrants | Haiti | 0.0 /100 | #308 | Tragic 96.7% |
| Sri Lankans | 0.0 /100 | #309 | Tragic 96.7% |
| Cape Verdeans | 0.0 /100 | #310 | Tragic 96.6% |