Zimbabwean vs Basque Child Poverty Under the Age of 5
COMPARE
Zimbabwean
Basque
Child Poverty Under the Age of 5
Child Poverty Under the Age of 5 Comparison
Zimbabweans
Basques
15.2%
CHILD POVERTY UNDER THE AGE OF 5
99.0/ 100
METRIC RATING
68th/ 347
METRIC RANK
16.0%
CHILD POVERTY UNDER THE AGE OF 5
93.4/ 100
METRIC RATING
117th/ 347
METRIC RANK
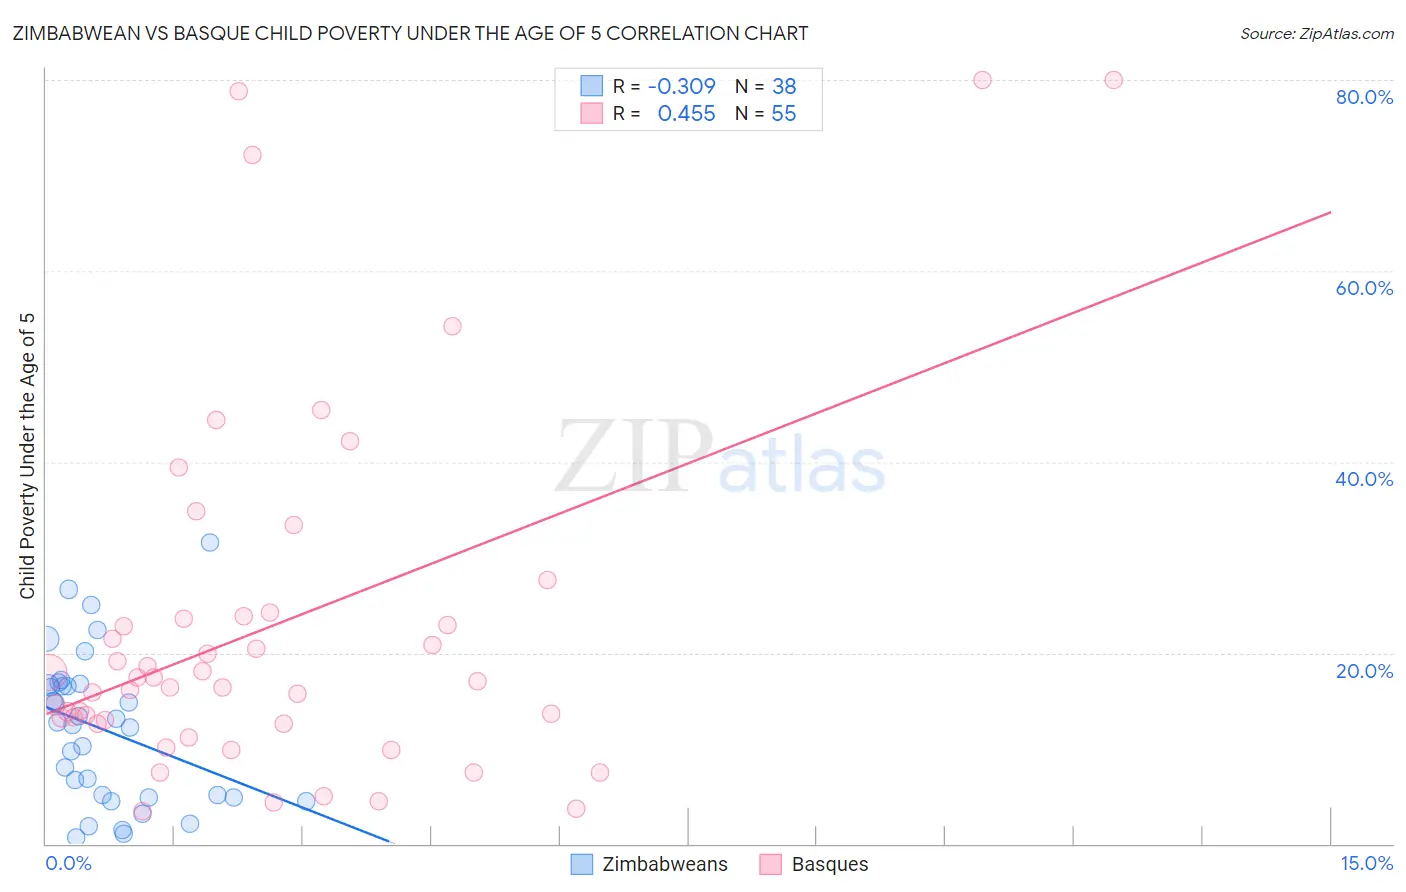
Zimbabwean vs Basque Child Poverty Under the Age of 5 Correlation Chart
The statistical analysis conducted on geographies consisting of 68,606,248 people shows a mild negative correlation between the proportion of Zimbabweans and poverty level among children under the age of 5 in the United States with a correlation coefficient (R) of -0.309 and weighted average of 15.2%. Similarly, the statistical analysis conducted on geographies consisting of 162,359,571 people shows a moderate positive correlation between the proportion of Basques and poverty level among children under the age of 5 in the United States with a correlation coefficient (R) of 0.455 and weighted average of 16.0%, a difference of 5.7%.
Child Poverty Under the Age of 5 Correlation Summary
| Measurement | Zimbabwean | Basque |
| Minimum | 0.66% | 3.4% |
| Maximum | 31.6% | 80.0% |
| Range | 31.0% | 76.6% |
| Mean | 11.9% | 22.8% |
| Median | 12.5% | 17.1% |
| Interquartile 25% (IQ1) | 4.9% | 12.6% |
| Interquartile 75% (IQ3) | 16.8% | 23.8% |
| Interquartile Range (IQR) | 11.9% | 11.2% |
| Standard Deviation (Sample) | 7.8% | 19.0% |
| Standard Deviation (Population) | 7.7% | 18.8% |
Similar Demographics by Child Poverty Under the Age of 5
Demographics Similar to Zimbabweans by Child Poverty Under the Age of 5
In terms of child poverty under the age of 5, the demographic groups most similar to Zimbabweans are Greek (15.2%, a difference of 0.0%), Lithuanian (15.2%, a difference of 0.010%), Immigrants from Scotland (15.2%, a difference of 0.070%), Immigrants from Fiji (15.2%, a difference of 0.18%), and Immigrants from Romania (15.2%, a difference of 0.21%).
| Demographics | Rating | Rank | Child Poverty Under the Age of 5 |
| Immigrants | Poland | 99.1 /100 | #61 | Exceptional 15.1% |
| Immigrants | Eastern Europe | 99.1 /100 | #62 | Exceptional 15.1% |
| Immigrants | Europe | 99.1 /100 | #63 | Exceptional 15.1% |
| Immigrants | Romania | 99.1 /100 | #64 | Exceptional 15.2% |
| Immigrants | Fiji | 99.0 /100 | #65 | Exceptional 15.2% |
| Immigrants | Scotland | 99.0 /100 | #66 | Exceptional 15.2% |
| Greeks | 99.0 /100 | #67 | Exceptional 15.2% |
| Zimbabweans | 99.0 /100 | #68 | Exceptional 15.2% |
| Lithuanians | 99.0 /100 | #69 | Exceptional 15.2% |
| Immigrants | Belgium | 98.8 /100 | #70 | Exceptional 15.3% |
| Immigrants | Egypt | 98.8 /100 | #71 | Exceptional 15.3% |
| Immigrants | Sweden | 98.8 /100 | #72 | Exceptional 15.3% |
| Immigrants | Ukraine | 98.7 /100 | #73 | Exceptional 15.3% |
| Argentineans | 98.5 /100 | #74 | Exceptional 15.4% |
| Immigrants | Argentina | 98.5 /100 | #75 | Exceptional 15.4% |
Demographics Similar to Basques by Child Poverty Under the Age of 5
In terms of child poverty under the age of 5, the demographic groups most similar to Basques are Immigrants from Denmark (16.0%, a difference of 0.0%), Immigrants from Austria (16.0%, a difference of 0.020%), Immigrants from Jordan (16.1%, a difference of 0.11%), Albanian (16.0%, a difference of 0.18%), and Immigrants from Kuwait (16.0%, a difference of 0.21%).
| Demographics | Rating | Rank | Child Poverty Under the Age of 5 |
| Romanians | 94.3 /100 | #110 | Exceptional 16.0% |
| Pakistanis | 94.2 /100 | #111 | Exceptional 16.0% |
| Peruvians | 94.1 /100 | #112 | Exceptional 16.0% |
| Puget Sound Salish | 94.1 /100 | #113 | Exceptional 16.0% |
| Immigrants | Kuwait | 93.9 /100 | #114 | Exceptional 16.0% |
| Albanians | 93.8 /100 | #115 | Exceptional 16.0% |
| Immigrants | Austria | 93.5 /100 | #116 | Exceptional 16.0% |
| Basques | 93.4 /100 | #117 | Exceptional 16.0% |
| Immigrants | Denmark | 93.4 /100 | #118 | Exceptional 16.0% |
| Immigrants | Jordan | 93.2 /100 | #119 | Exceptional 16.1% |
| Immigrants | Peru | 92.6 /100 | #120 | Exceptional 16.1% |
| Mongolians | 92.5 /100 | #121 | Exceptional 16.1% |
| Immigrants | Southern Europe | 92.0 /100 | #122 | Exceptional 16.1% |
| Austrians | 92.0 /100 | #123 | Exceptional 16.1% |
| Swiss | 92.0 /100 | #124 | Exceptional 16.1% |