Zimbabwean vs Basque 5th Grade

COMPARE

Zimbabwean
Race
Ancestry
AfghanAfricanAlaska NativeAlaskan AthabascanAlbanianAleutAlsatianAmericanApacheArabArapahoArgentineanArmenianAssyrian/Chaldean/SyriacAustralianAustrianBahamianBangladeshiBarbadianBelgianBelizeanBermudanBhutaneseBlackfeetBolivianBrazilianBritishBritish West IndianBulgarianBurmeseCajunCambodianCanadianCape VerdeanCarpatho RusynCelticCentral AmericanCentral American IndianCherokeeCheyenneChickasawChileanChineseChippewaChoctawColombianColvilleComancheCosta RicanCreeCreekCroatianCrowCubanCypriotCzechCzechoslovakianDanishDelawareDominicanDutchDutch West IndianEastern EuropeanEcuadorianEgyptianEnglishEstonianEthiopianEuropeanFijianFilipinoFinnishFrenchFrench American IndianFrench CanadianGermanGerman RussianGhanaianGreekGuamanian/ChamorroGuatemalanGuyaneseHaitianHmongHonduranHopiHoumaHungarianIcelanderIndian (Asian)IndonesianInupiatIranianIraqiIrishIroquoisIsraeliItalianJamaicanJapaneseJordanianKenyanKiowaKoreanLaotianLatvianLebaneseLiberianLithuanianLumbeeLuxembourgerMacedonianMalaysianMalteseMarshalleseMenomineeMexicanMexican American IndianMongolianMoroccanNative HawaiianNavajoNepaleseNew ZealanderNicaraguanNigerianNorthern EuropeanNorwegianOkinawanOsageOttawaPaiutePakistaniPalestinianPanamanianParaguayanPennsylvania GermanPeruvianPimaPolishPortuguesePotawatomiPuebloPuerto RicanPuget Sound SalishRomanianRussianSalvadoranSamoanScandinavianScotch-IrishScottishSeminoleSenegaleseSerbianShoshoneSierra LeoneanSiouxSlavicSlovakSloveneSomaliSouth AfricanSouth AmericanSouth American IndianSoviet UnionSpaniardSpanishSpanish AmericanSpanish American IndianSri LankanSubsaharan AfricanSudaneseSwedishSwissSyrianTaiwaneseThaiTlingit-HaidaTohono O'OdhamTonganTrinidadian and TobagonianTsimshianTurkishU.S. Virgin IslanderUgandanUkrainianUruguayanUteVenezuelanVietnameseWelshWest IndianYakamaYaquiYugoslavianYumanYup'ikZimbabwean
Immigration
NonimmigrantsImmigrantsAfghanistanAfricaAlbaniaArgentinaArmeniaAsiaAustraliaAustriaBahamasBangladeshBarbadosBelarusBelgiumBelizeBoliviaBosnia and HerzegovinaBrazilBulgariaBurma/MyanmarCabo VerdeCambodiaCameroonCanadaCaribbeanCentral AmericaChileChinaColombiaCongoCosta RicaCroatiaCubaCzechoslovakiaDenmarkDominicaDominican RepublicEastern AfricaEastern AsiaEastern EuropeEcuadorEgyptEl SalvadorEnglandEritreaEthiopiaEuropeFijiFranceGermanyGhanaGreeceGrenadaGuatemalaGuyanaHaitiHondurasHong KongHungaryIndiaIndonesiaIranIraqIrelandIsraelItalyJamaicaJapanJordanKazakhstanKenyaKoreaKuwaitLaosLatin AmericaLatviaLebanonLiberiaLithuaniaMalaysiaMexicoMicronesiaMiddle AfricaMoldovaMoroccoNepalNetherlandsNicaraguaNigeriaNorth AmericaNorth MacedoniaNorthern AfricaNorthern EuropeNorwayOceaniaPakistanPanamaPeruPhilippinesPolandPortugalRomaniaRussiaSaudi ArabiaScotlandSenegalSerbiaSierra LeoneSingaporeSomaliaSouth AfricaSouth AmericaSouth Central AsiaSouth Eastern AsiaSouthern EuropeSpainSri LankaSt. Vincent and the GrenadinesSudanSwedenSwitzerlandSyriaTaiwanThailandTrinidad and TobagoTurkeyUgandaUkraineUruguayUzbekistanVenezuelaVietnamWest IndiesWestern AfricaWestern AsiaWestern EuropeYemenZaireZimbabweAzores
Basque
Race
Ancestry
AfghanAfricanAlaska NativeAlaskan AthabascanAlbanianAleutAlsatianAmericanApacheArabArapahoArgentineanArmenianAssyrian/Chaldean/SyriacAustralianAustrianBahamianBangladeshiBarbadianBasqueBelgianBelizeanBermudanBhutaneseBlackfeetBolivianBrazilianBritishBritish West IndianBulgarianBurmeseCajunCambodianCanadianCape VerdeanCarpatho RusynCelticCentral AmericanCentral American IndianCherokeeCheyenneChickasawChileanChineseChippewaChoctawColombianColvilleComancheCosta RicanCreeCreekCroatianCrowCubanCypriotCzechCzechoslovakianDanishDelawareDominicanDutchDutch West IndianEastern EuropeanEcuadorianEgyptianEnglishEstonianEthiopianEuropeanFijianFilipinoFinnishFrenchFrench American IndianFrench CanadianGermanGerman RussianGhanaianGreekGuamanian/ChamorroGuatemalanGuyaneseHaitianHmongHonduranHopiHoumaHungarianIcelanderIndian (Asian)IndonesianInupiatIranianIraqiIrishIroquoisIsraeliItalianJamaicanJapaneseJordanianKenyanKiowaKoreanLaotianLatvianLebaneseLiberianLithuanianLumbeeLuxembourgerMacedonianMalaysianMalteseMarshalleseMenomineeMexicanMexican American IndianMongolianMoroccanNative HawaiianNavajoNepaleseNew ZealanderNicaraguanNigerianNorthern EuropeanNorwegianOkinawanOsageOttawaPaiutePakistaniPalestinianPanamanianParaguayanPennsylvania GermanPeruvianPimaPolishPortuguesePotawatomiPuebloPuerto RicanPuget Sound SalishRomanianRussianSalvadoranSamoanScandinavianScotch-IrishScottishSeminoleSenegaleseSerbianShoshoneSierra LeoneanSiouxSlavicSlovakSloveneSomaliSouth AfricanSouth AmericanSouth American IndianSoviet UnionSpaniardSpanishSpanish AmericanSpanish American IndianSri LankanSubsaharan AfricanSudaneseSwedishSwissSyrianTaiwaneseThaiTlingit-HaidaTohono O'OdhamTonganTrinidadian and TobagonianTsimshianTurkishU.S. Virgin IslanderUgandanUkrainianUruguayanUteVenezuelanVietnameseWelshWest IndianYakamaYaquiYugoslavianYumanYup'ik
Immigration
NonimmigrantsImmigrantsAfghanistanAfricaAlbaniaArgentinaArmeniaAsiaAustraliaAustriaBahamasBangladeshBarbadosBelarusBelgiumBelizeBoliviaBosnia and HerzegovinaBrazilBulgariaBurma/MyanmarCabo VerdeCambodiaCameroonCanadaCaribbeanCentral AmericaChileChinaColombiaCongoCosta RicaCroatiaCubaCzechoslovakiaDenmarkDominicaDominican RepublicEastern AfricaEastern AsiaEastern EuropeEcuadorEgyptEl SalvadorEnglandEritreaEthiopiaEuropeFijiFranceGermanyGhanaGreeceGrenadaGuatemalaGuyanaHaitiHondurasHong KongHungaryIndiaIndonesiaIranIraqIrelandIsraelItalyJamaicaJapanJordanKazakhstanKenyaKoreaKuwaitLaosLatin AmericaLatviaLebanonLiberiaLithuaniaMalaysiaMexicoMicronesiaMiddle AfricaMoldovaMoroccoNepalNetherlandsNicaraguaNigeriaNorth AmericaNorth MacedoniaNorthern AfricaNorthern EuropeNorwayOceaniaPakistanPanamaPeruPhilippinesPolandPortugalRomaniaRussiaSaudi ArabiaScotlandSenegalSerbiaSierra LeoneSingaporeSomaliaSouth AfricaSouth AmericaSouth Central AsiaSouth Eastern AsiaSouthern EuropeSpainSri LankaSt. Vincent and the GrenadinesSudanSwedenSwitzerlandSyriaTaiwanThailandTrinidad and TobagoTurkeyUgandaUkraineUruguayUzbekistanVenezuelaVietnamWest IndiesWestern AfricaWestern AsiaWestern EuropeYemenZaireZimbabweAzores
5th Grade
Income
Poverty
Unemployment
Labor Participation
Family Structure
Vehicle Availability
Education Level
Disability

5th Grade Comparison

Zimbabweans

Basques

Exceptional
Exceptional
97.8%
5TH GRADE
99.0/ 100
METRIC RATING
83rd/ 347
METRIC RANK
97.6%
5TH GRADE
95.2/ 100
METRIC RATING
118th/ 347
METRIC RANK

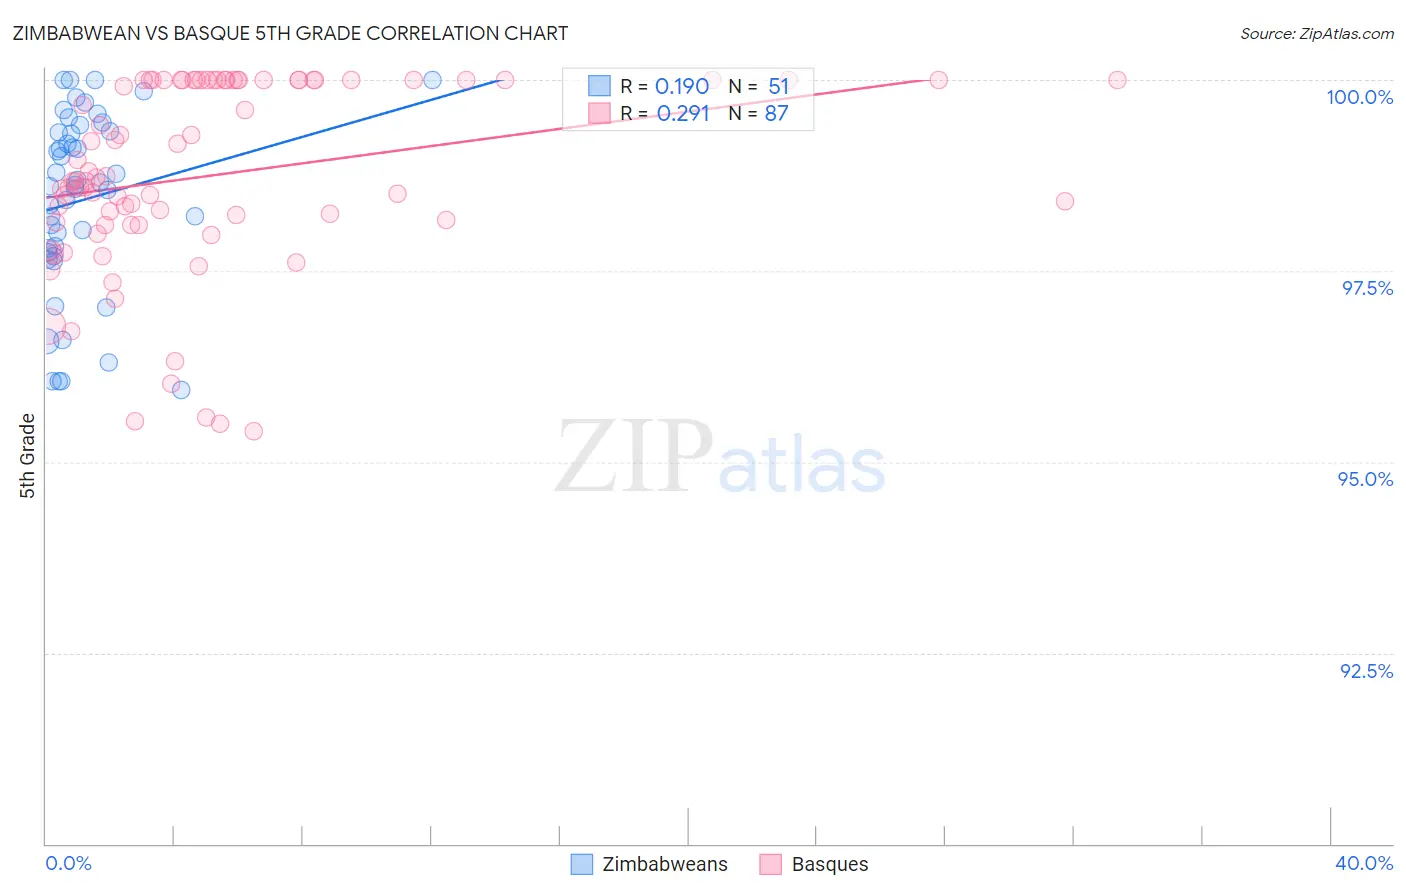
Zimbabwean vs Basque 5th Grade Correlation Chart

The statistical analysis conducted on geographies consisting of 69,203,423 people shows a poor positive correlation between the proportion of Zimbabweans and percentage of population with at least 5th grade education in the United States with a correlation coefficient (R) of 0.190 and weighted average of 97.8%. Similarly, the statistical analysis conducted on geographies consisting of 165,774,137 people shows a weak positive correlation between the proportion of Basques and percentage of population with at least 5th grade education in the United States with a correlation coefficient (R) of 0.291 and weighted average of 97.6%, a difference of 0.17%.
Zimbabwean vs Basque 5th Grade

5th Grade Correlation Summary

MeasurementZimbabweanBasque
Minimum95.9%95.4%
Maximum100.0%100.0%
Range4.1%4.6%
Mean98.4%98.8%
Median98.6%98.7%
Interquartile 25% (IQ1)97.7%98.1%
Interquartile 75% (IQ3)99.3%100.0%
Interquartile Range (IQR)1.6%1.9%
Standard Deviation (Sample)1.2%1.2%
Standard Deviation (Population)1.2%1.2%

Similar Demographics by 5th Grade

Demographics Similar to Zimbabweans by 5th Grade

In terms of 5th grade, the demographic groups most similar to Zimbabweans are Potawatomi (97.8%, a difference of 0.0%), Immigrants from Belgium (97.8%, a difference of 0.0%), Cypriot (97.8%, a difference of 0.010%), Immigrants from Lithuania (97.8%, a difference of 0.020%), and Immigrants from India (97.8%, a difference of 0.020%).
DemographicsRating | Rank5th Grade
Immigrants | Netherlands
99.3
/100
|
#76
Exceptional
97.8%
Immigrants | England
99.3
/100
|
#77
Exceptional
97.8%
Osage
99.3
/100
|
#78
Exceptional
97.8%
Immigrants | Lithuania
99.2
/100
|
#79
Exceptional
97.8%
Immigrants | India
99.2
/100
|
#80
Exceptional
97.8%
Icelanders
99.2
/100
|
#81
Exceptional
97.8%
Pueblo
99.2
/100
|
#82
Exceptional
97.8%
Zimbabweans
99.0
/100
|
#83
Exceptional
97.8%
Potawatomi
99.0
/100
|
#84
Exceptional
97.8%
Immigrants | Belgium
99.0
/100
|
#85
Exceptional
97.8%
Cypriots
98.9
/100
|
#86
Exceptional
97.8%
Immigrants | Australia
98.8
/100
|
#87
Exceptional
97.8%
Shoshone
98.8
/100
|
#88
Exceptional
97.8%
Immigrants | South Africa
98.8
/100
|
#89
Exceptional
97.8%
Immigrants | Ireland
98.8
/100
|
#90
Exceptional
97.8%

Demographics Similar to Basques by 5th Grade

In terms of 5th grade, the demographic groups most similar to Basques are Immigrants from Saudi Arabia (97.6%, a difference of 0.0%), Syrian (97.6%, a difference of 0.0%), Lebanese (97.6%, a difference of 0.010%), Okinawan (97.6%, a difference of 0.010%), and Immigrants from Croatia (97.6%, a difference of 0.010%).
DemographicsRating | Rank5th Grade
Menominee
96.3
/100
|
#111
Exceptional
97.7%
Immigrants | Switzerland
96.0
/100
|
#112
Exceptional
97.7%
Iroquois
95.9
/100
|
#113
Exceptional
97.7%
Lebanese
95.7
/100
|
#114
Exceptional
97.6%
Okinawans
95.7
/100
|
#115
Exceptional
97.6%
Immigrants | Croatia
95.5
/100
|
#116
Exceptional
97.6%
Immigrants | Saudi Arabia
95.4
/100
|
#117
Exceptional
97.6%
Basques
95.2
/100
|
#118
Exceptional
97.6%
Syrians
95.1
/100
|
#119
Exceptional
97.6%
Immigrants | Zimbabwe
94.9
/100
|
#120
Exceptional
97.6%
Immigrants | France
94.8
/100
|
#121
Exceptional
97.6%
Immigrants | Japan
94.7
/100
|
#122
Exceptional
97.6%
Immigrants | Norway
94.6
/100
|
#123
Exceptional
97.6%
Spanish
93.7
/100
|
#124
Exceptional
97.6%
Immigrants | Bulgaria
93.1
/100
|
#125
Exceptional
97.6%